Full Report
The numbers behind Molina Healthcare, Inc.: as-reported financial statements and company metrics for FY2021–FY2025, traced to the source filings, opened with the share-price history those statements have to justify. Every linked figure opens the exact page of the filing it was printed on, with the statement row highlighted. Amounts in US$ millions unless noted.
Reading notes: All figures in US$ millions as printed in the filings, except per-share (US$) and ratio/percent rows. Fiscal year ends December 31. Each FY2021–FY2025 column is cited to that year's own Form 10-K (income and cash flow statements print three years; balance sheets print two). Every core-statement cell in the FY2021–FY2025 columns is filing-verified. Revenue breakdown and medical margin are the company's reported segments — Medicaid, Medicare, Marketplace and (from FY2024/FY2025) Other — taken from the MD A 'Segment Financial Performance' premium/medical-margin/MCR tables. The 'Other' segment premium is reported only from FY2025 ($90M); it was nil or not separately shown earlier. Long-term record FY2016–FY2020 figures are from the standardized data feed (SEC XBRL) and are shown without page links; FY2021–FY2025 are filing-linked.
Share Price — Full Available History — 23 Years
The stock closed at $224.82 on Jul 16, 2026 — up 2,429% over the window shown (+15.1% a year), trading between $7.44 and $419.53. At that close the stock trades at 25× FY2025 diluted EPS as reported below.
Source: market price feed, monthly closes, sampled from 5,796 source observations, Jul 2003–Jul 2026. Price return only, excludes dividends. Prices are split-adjusted (×1.5 on May 23, 2011).
FY2025 at a Glance
Revenue (US$ millions)
Operating income (US$ millions)
Net income (US$ millions)
Diluted EPS
Source: FY2025 consolidated statements [1] [2] [3] [4]. Click any linked figure to open the filing page with the row highlighted.
Premium Revenue by Program
| Premium Revenue by Program | FY2021 | FY2022 | FY2023 | FY2024 | FY2025 |
|---|---|---|---|---|---|
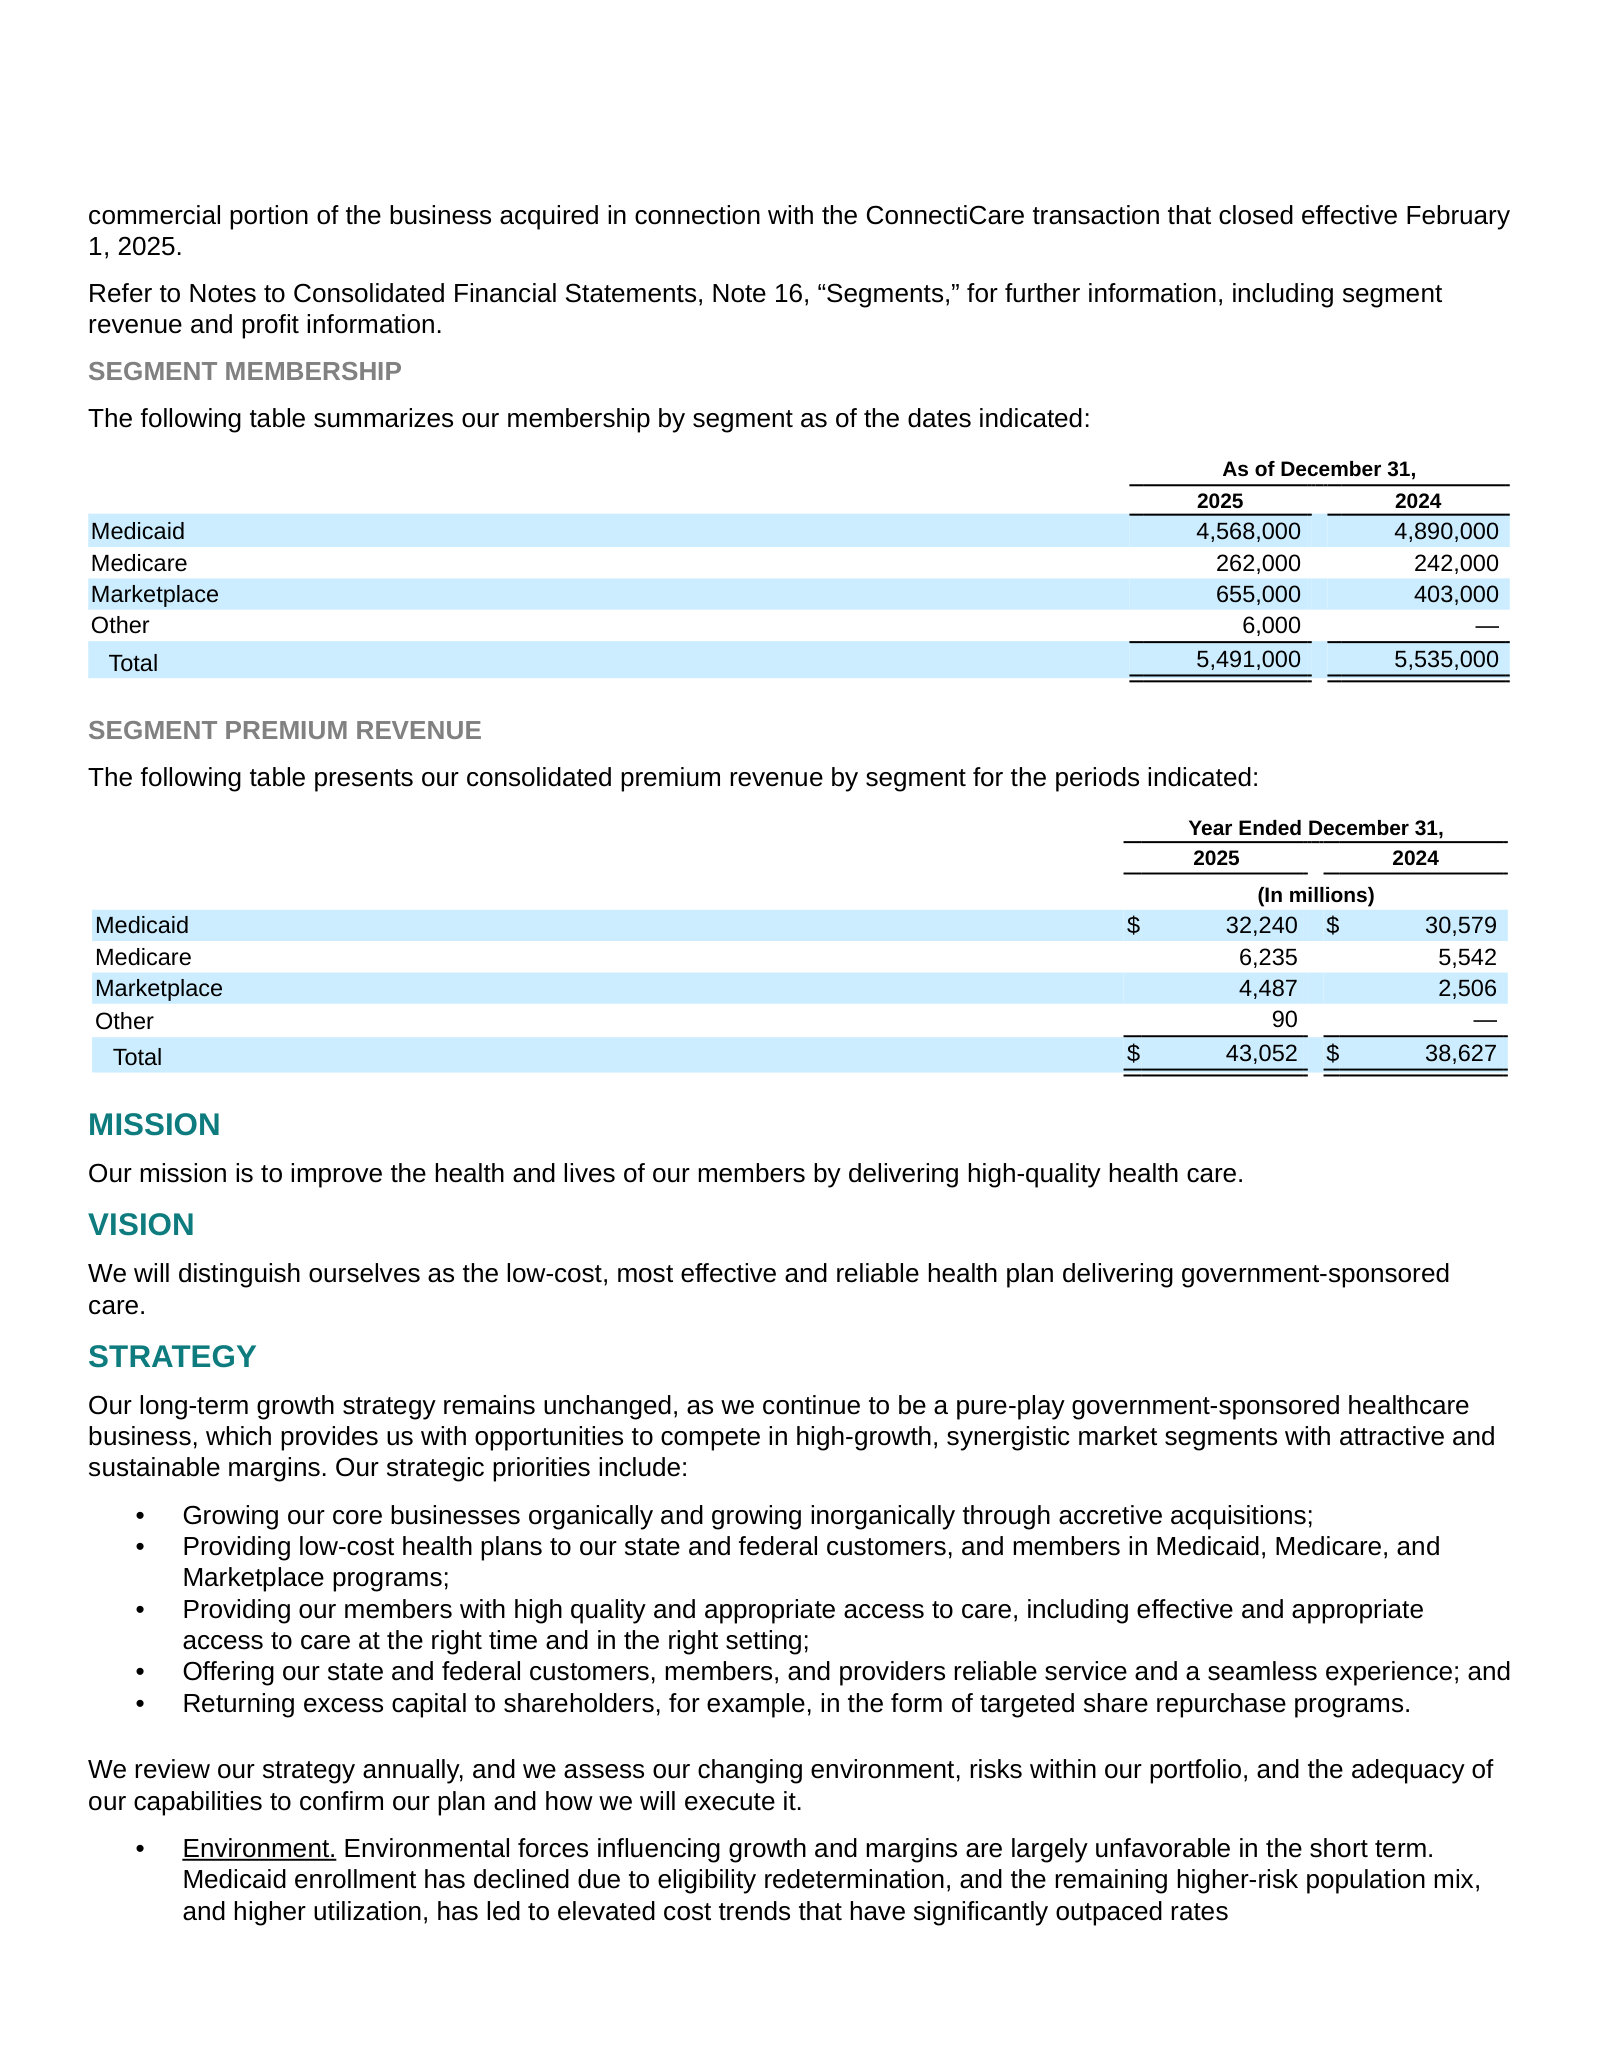
| Medicaid | 20,461 | 24,827 | 26,327 | 30,579 | 32,240 |
| Medicare | 3,361 | 3,795 | 4,179 | 5,542 | 6,235 |
| Marketplace | 3,033 | 2,261 | 2,023 | 2,506 | 4,487 |
| Other | — | — | — | — | 90 |
| Total premium revenue | 26,855 | 30,883 | 32,529 | 38,627 | 43,052 |
| Total premium revenue growth, derived | — | +15.0% | +5.3% | +18.7% | +11.5% |
Source: Form 10-K MD&A Segment Financial Performance — premium revenue by segment [5] [6] [7] [8]. Click any linked figure to open the filing page with the row highlighted.
Medical Margin by Program
| Medical Margin by Program | FY2021 | FY2022 | FY2023 | FY2024 | FY2025 |
|---|---|---|---|---|---|
| Medicaid | 2,322 | 2,981 | 2,973 | 2,979 | 2,652 |
| Medicare | 430 | 437 | 388 | 603 | 475 |
| Marketplace | 399 | 290 | 499 | 617 | 423 |
| Other | — | — | — | — | 14 |
| Total medical margin | 3,151 | 3,708 | 3,860 | 4,199 | 3,564 |
Source: Form 10-K MD&A Segment Financial Performance — medical margin by segment [5] [6] [7] [8]. Click any linked figure to open the filing page with the row highlighted.
Income Statement
Source: Consolidated Statements of Income [1] [2] [3] [4]. Click any linked figure to open the filing page with the row highlighted.
Columns marked E are consensus analyst estimates shown alongside reported results for direct comparison; they are not company guidance.
Estimate source: Yahoo Finance analyst consensus, as of 2026-07-17. Estimate figures link to the consensus source, not to filing pages.
Balance Sheet
Source: Consolidated Balance Sheets [9] [10] [11] [12]. Click any linked figure to open the filing page with the row highlighted.
Cash Flow
Source: Consolidated Statements of Cash Flows [13] [14] [15] [16]. Click any linked figure to open the filing page with the row highlighted.
Membership by Program
| Membership by Program | FY2021 | FY2022 | FY2023 | FY2024 | FY2025 |
|---|---|---|---|---|---|
| Medicaid members | 4,329,000 | 4,754,000 | 4,542,000 | 4,890,000 | 4,568,000 |
| Medicare members | 142,000 | 156,000 | 172,000 | 242,000 | 262,000 |
| Marketplace members | 728,000 | 348,000 | 281,000 | 403,000 | 655,000 |
| Total ending membership | 5,199,000 | 5,258,000 | 4,995,000 | 5,535,000 | 5,491,000 |
Source: company filings [17] [6] [18] [8]. Click any linked figure to open the filing page with the row highlighted.
Medical Care Ratio (MCR)
| Medical Care Ratio (MCR) | FY2021 | FY2022 | FY2023 | FY2024 | FY2025 |
|---|---|---|---|---|---|
| Consolidated MCR | 88.3% | 88.0% | 88.1% | 89.1% | 91.7% |
| Medicaid MCR | 88.7% | 88.0% | 88.7% | 90.3% | 91.8% |
| Medicare MCR | 87.2% | 88.5% | 90.7% | 89.1% | 92.4% |
| Marketplace MCR | 86.9% | 87.2% | 75.3% | 75.4% | 90.6% |
Source: company filings [5] [6] [7] [8]. Click any linked figure to open the filing page with the row highlighted.
Cost, Tax Capital Efficiency
| Cost, Tax Capital Efficiency | FY2021 | FY2022 | FY2023 | FY2024 | FY2025 |
|---|---|---|---|---|---|
| G A ratio | 7.4% | 7.2% | 7.2% | 6.7% | 6.6% |
| Premium tax ratio | 2.8% | 2.7% | 3.2% | 3.7% | 4.1% |
| Effective income tax rate | 24.7% | 25.5% | 25.5% | 25.8% | 19.8% |
| Diluted weighted-average shares (millions) | 59 | 58 | 58 | 58 | 53 |
Source: company filings [19] [20] [21] [22]. Click any linked figure to open the filing page with the row highlighted.
Long-Term Record
| Fiscal year | Total revenue | Operating income | Net income | Diluted earnings per share | Net cash from operating activities | Total stockholders' equity |
|---|---|---|---|---|---|---|
| FY2016 | 17,782 | 306 | 52 | 0.92 | 673 | 1,649 |
| FY2017 | 19,883 | (555) | (512) | (9.07) | 804 | 1,337 |
| FY2018 | 18,890 | 1,131 | 707 | 10.61 | (314) | 1,647 |
| FY2019 | 16,829 | 1,044 | 737 | 11.47 | 434 | 1,960 |
| FY2020 | 19,423 | 1,078 | 673 | 11.23 | 1,898 | 2,096 |
| FY2021 | 27,771 | 1,020 | 659 | 11.25 | 2,119 | 2,630 |
| FY2022 | 31,974 | 1,173 | 792 | 13.55 | 773 | 2,964 |
| FY2023 | 34,072 | 1,573 | 1,091 | 18.77 | 1,662 | 4,215 |
| FY2024 | 40,650 | 1,707 | 1,179 | 20.42 | 644 | 4,496 |
| FY2025 | 45,426 | 781 | 472 | 8.92 | (535) | 4,069 |
Source: consolidated statements across filings; older years from the standardized feed [13] [9] [1] [14]. Click any linked figure to open the filing page with the row highlighted.
Operating KPIs
| KPI | FY2021 | FY2022 | FY2023 | FY2024 | FY2025 |
|---|---|---|---|---|---|
| Total membership | 5,199,000 | 5,258,000 | 4,995,000 | 5,535,000 | 5,491,000 |
| Medicaid membership | 4,329,000 | 4,754,000 | 4,542,000 | 4,890,000 | 4,568,000 |
| Marketplace membership | 728,000 | 348,000 | 281,000 | 403,000 | 655,000 |
| Consolidated medical care ratio (MCR) | 88.3% | 88.0% | 88.1% | 89.1% | 91.7% |
Source: company-reported operating metrics [5] [17] [6] [7]. Click any linked figure to open the filing page with the row highlighted.
Analyst Consensus
Current price
Mean target
Median target
High target
Low target
Estimate source: Yahoo Finance analyst consensus, as of 2026-07-17. Estimate figures link to the consensus source, not to filing pages.
Traceability
366 of 396 figures on this page (92%) link to the filing page where they are printed — click a linked figure to open the source PDF at that page with the row highlighted. Unlinked figures come from standardized data feeds or pre-filing years.
All figures in US$ millions as printed in the filings, except per-share (US$) and ratio/percent rows. Fiscal year ends December 31.
Each FY2021–FY2025 column is cited to that year's own Form 10-K (income and cash flow statements print three years; balance sheets print two). Every core-statement cell in the FY2021–FY2025 columns is filing-verified.
Revenue breakdown and medical margin are the company's reported segments — Medicaid, Medicare, Marketplace and (from FY2024/FY2025) Other — taken from the MD A 'Segment Financial Performance' premium/medical-margin/MCR tables. The 'Other' segment premium is reported only from FY2025 ($90M); it was nil or not separately shown earlier.
Long-term record FY2016–FY2020 figures are from the standardized data feed (SEC XBRL) and are shown without page links; FY2021–FY2025 are filing-linked.
Quarterly Q4 FY25 income columns are derived (full-year FY2025 10-K less nine-month YTD from the Q3 FY2025 10-Q) and cross-check exactly to the quarterly data feed. Quarterly single-quarter operating cash flow is derived from printed year-to-date statements and also cross-checks to the feed.
1 figure(s) differed between the data feed and the filing; the filing value is shown (see the run's metrics/metrics_tab.json for the audit trail).
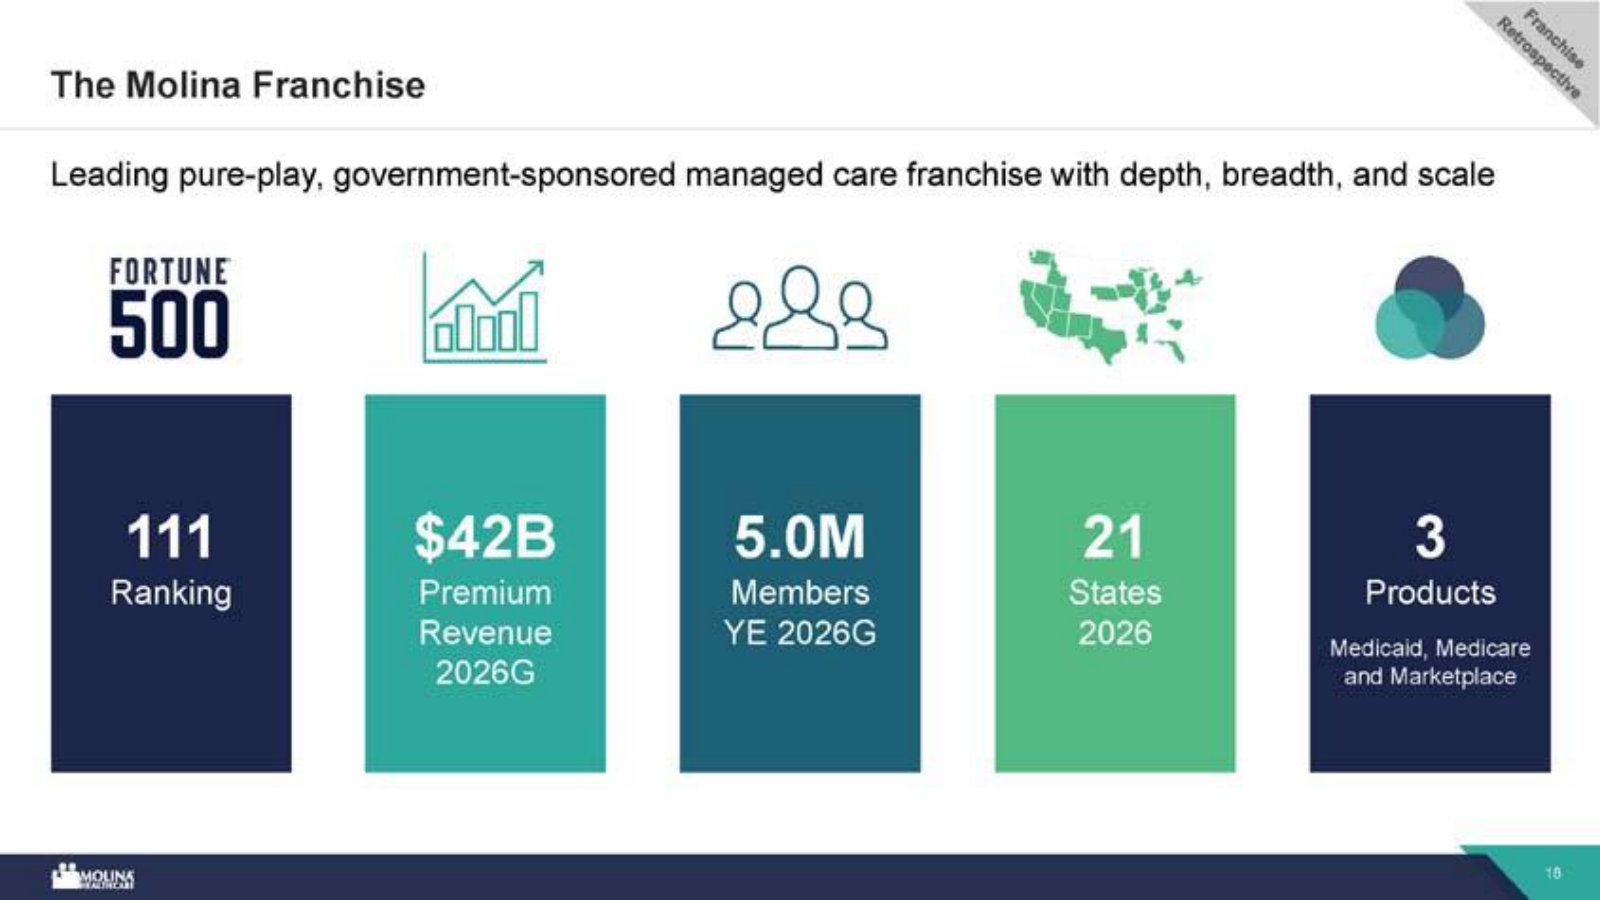
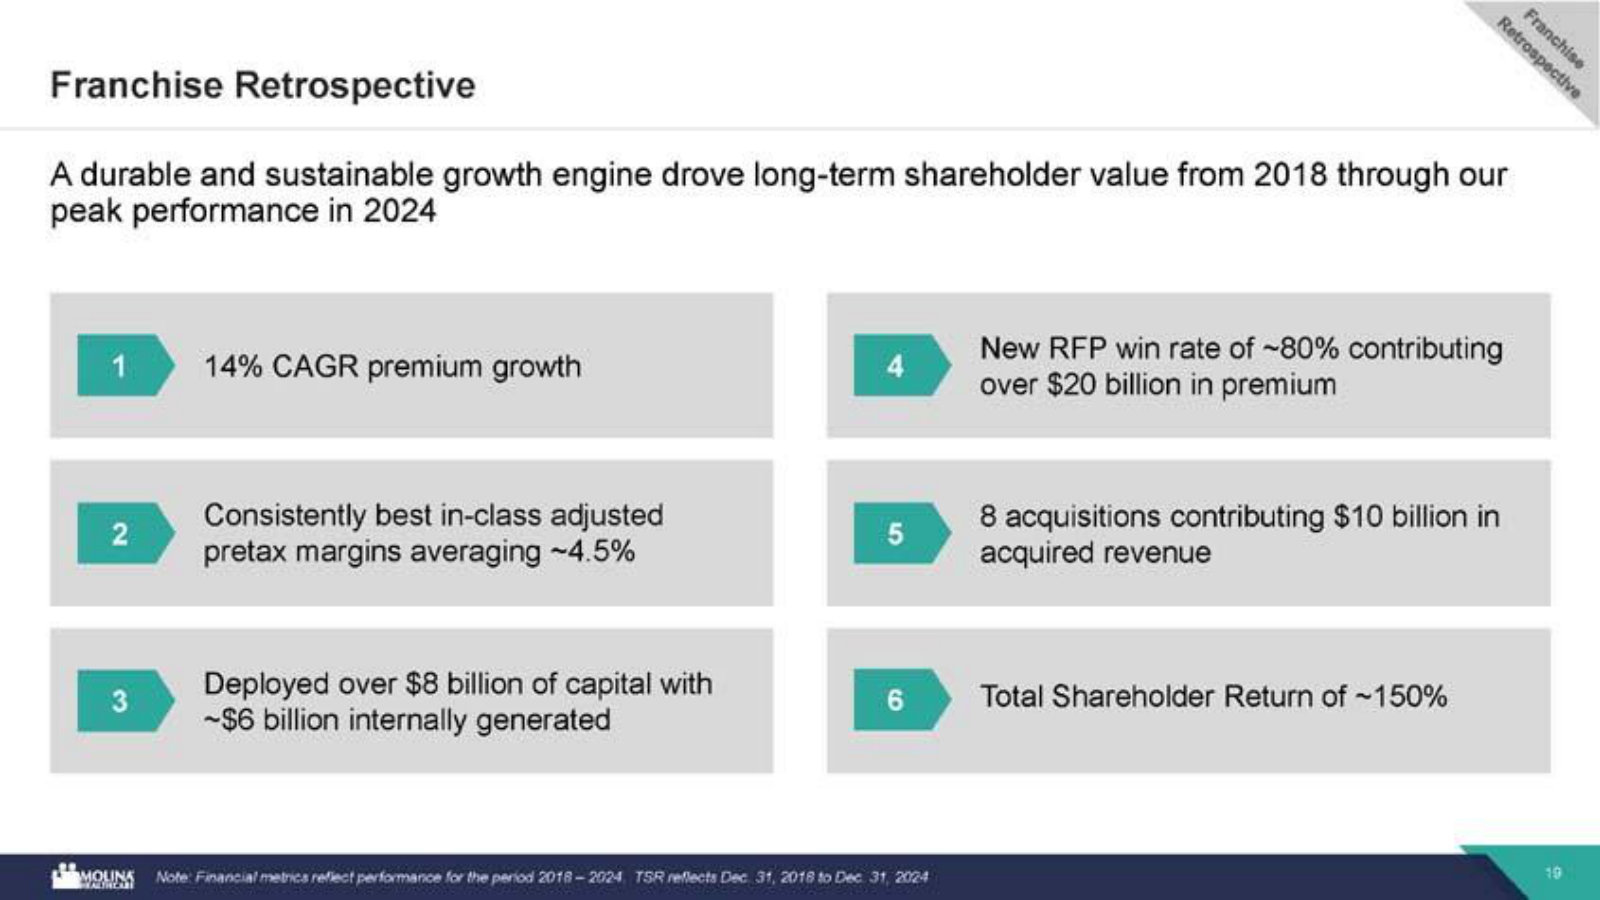
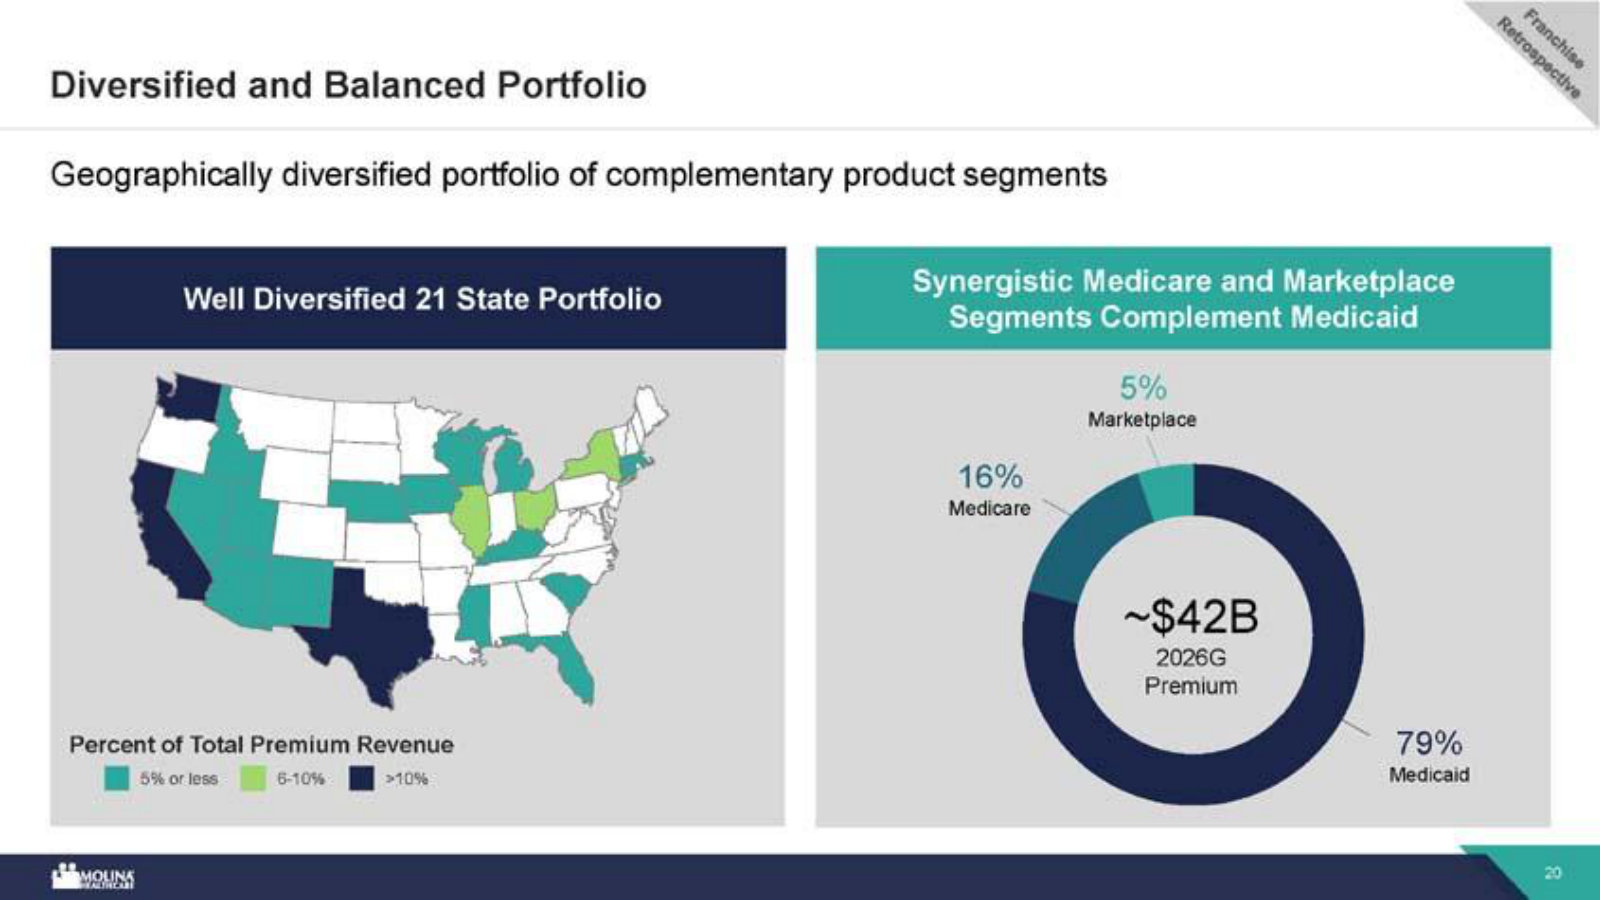
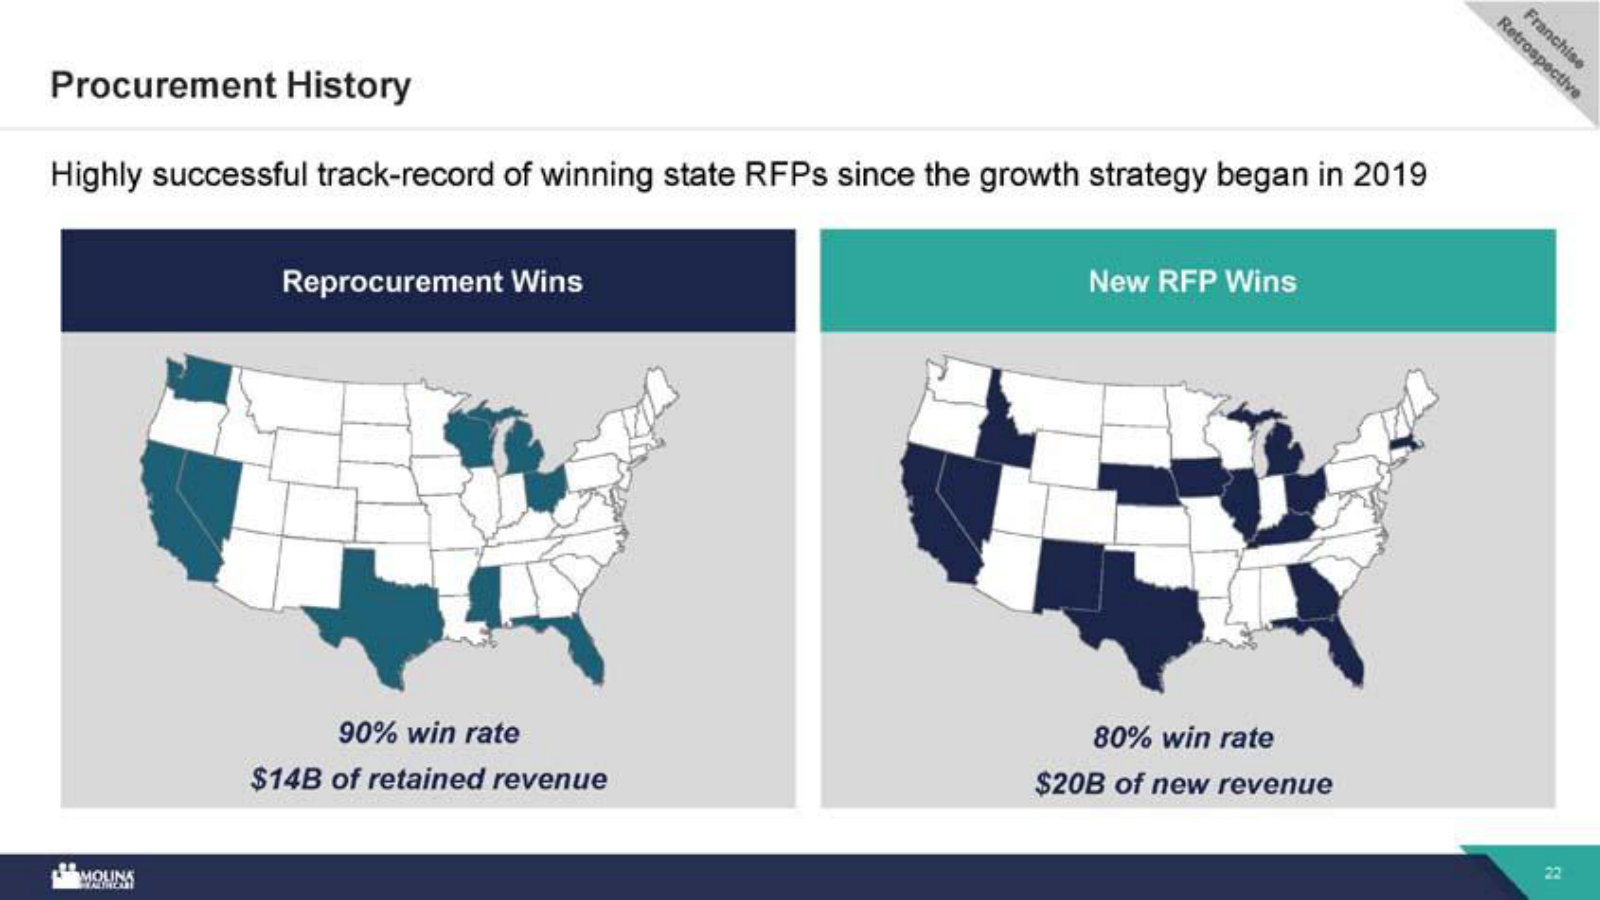
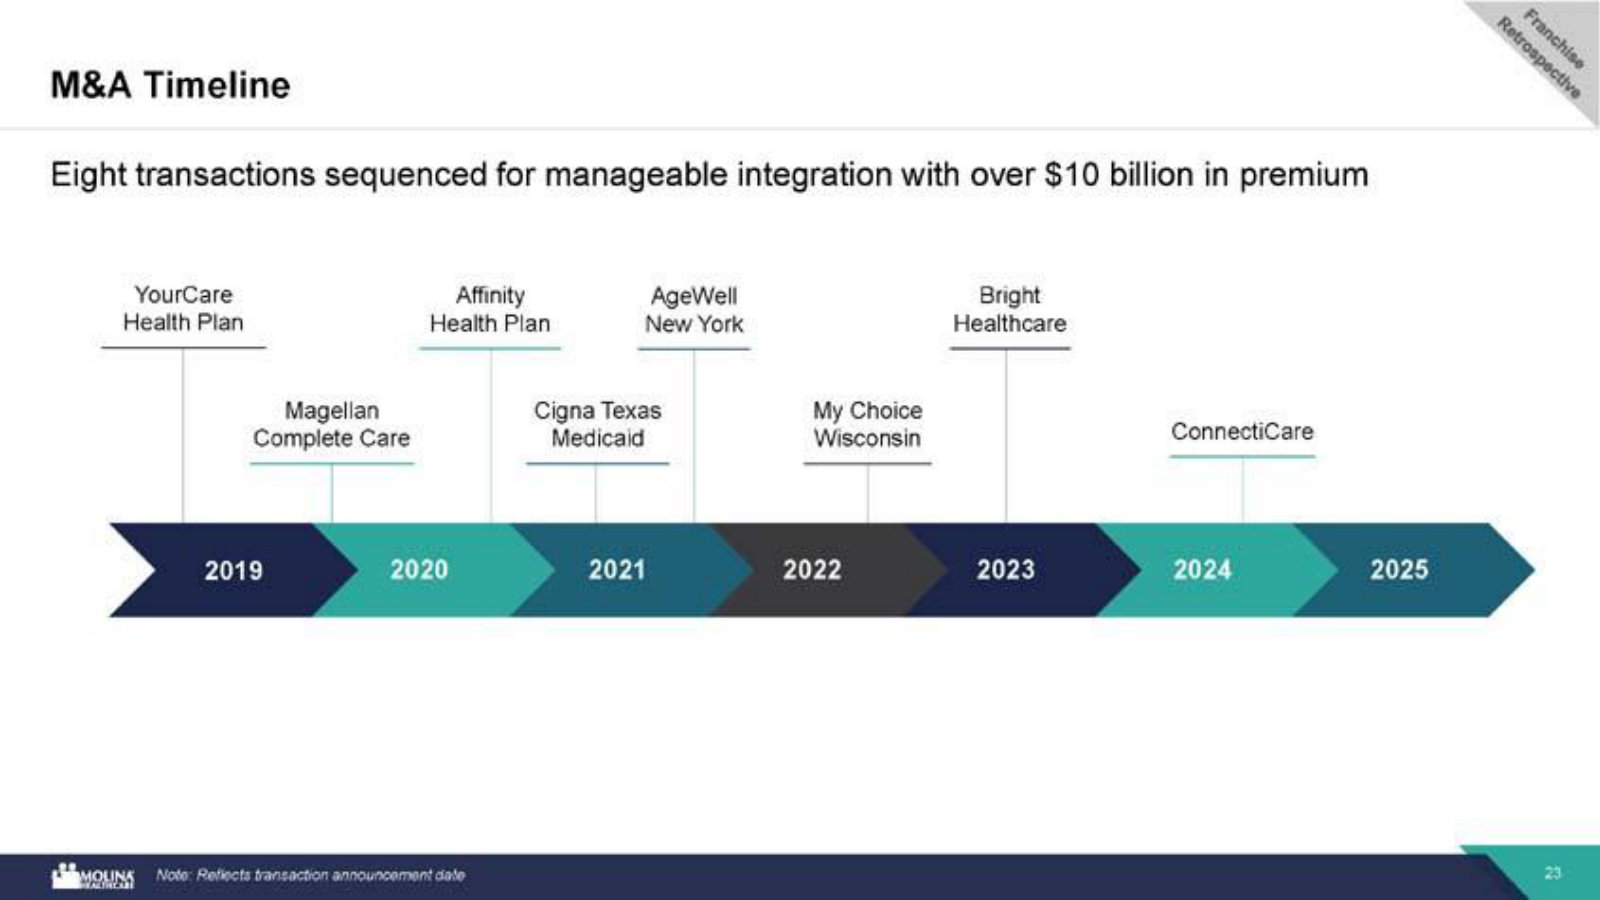
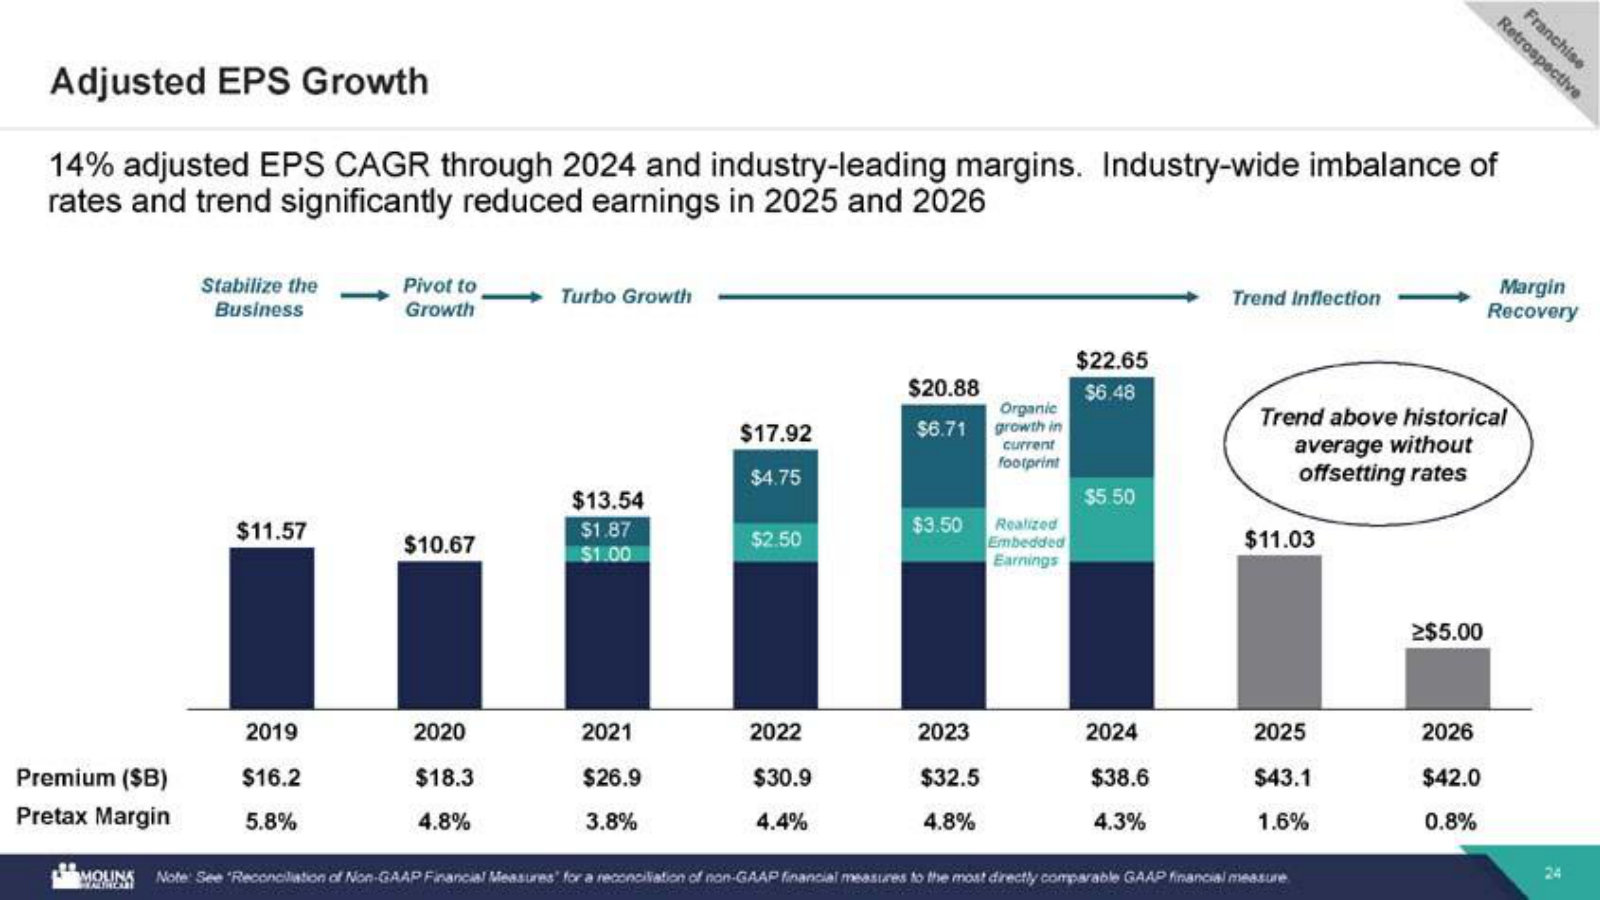
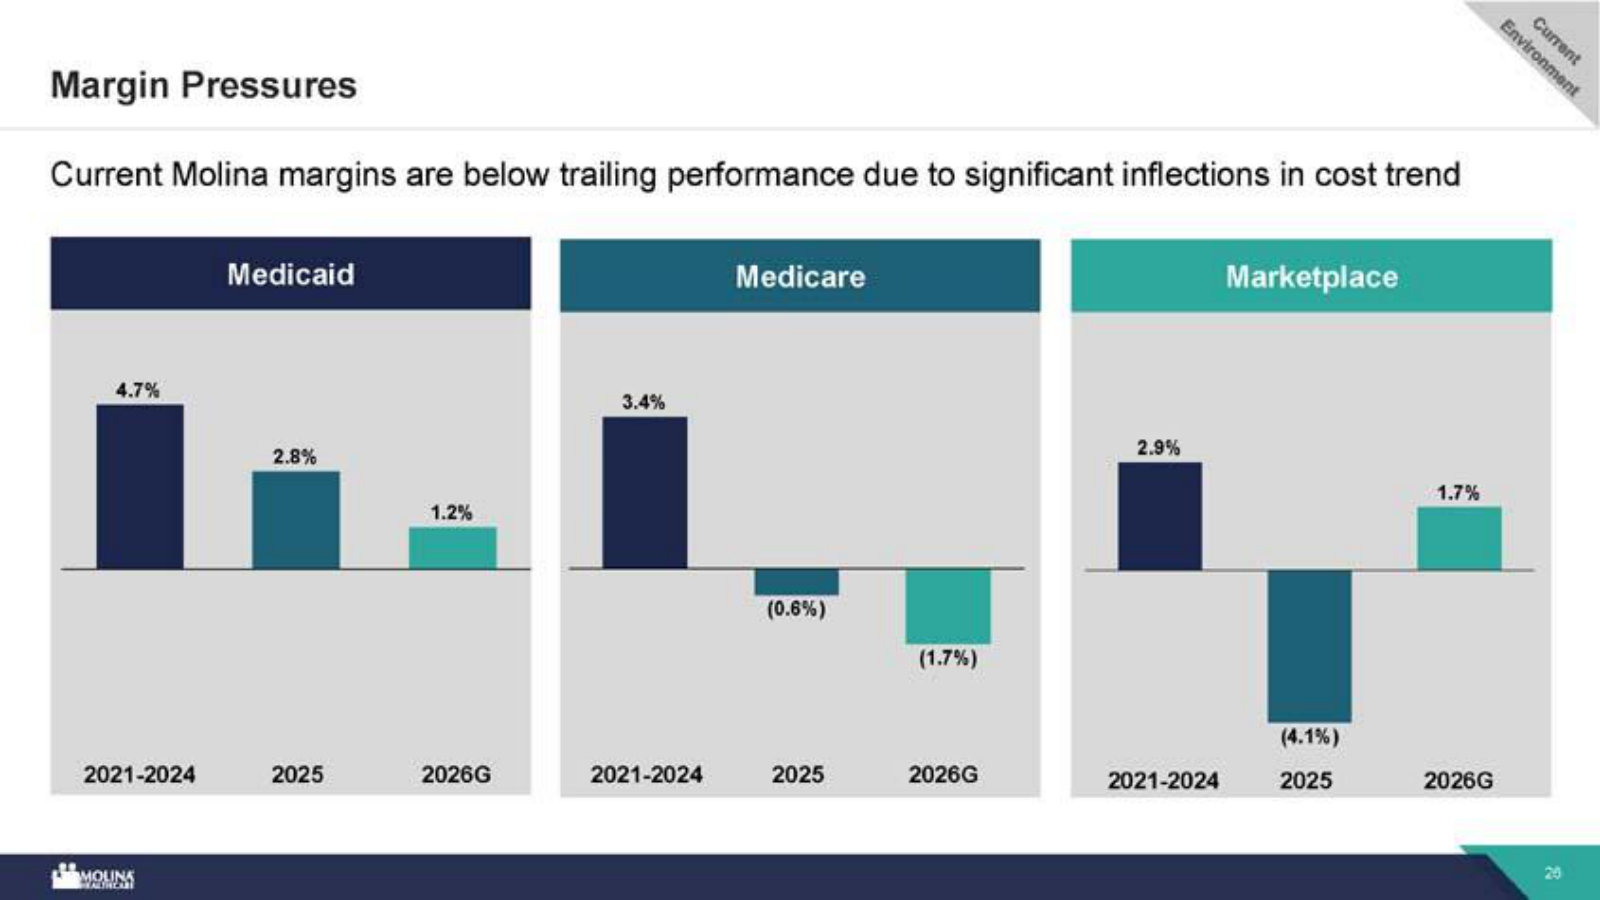
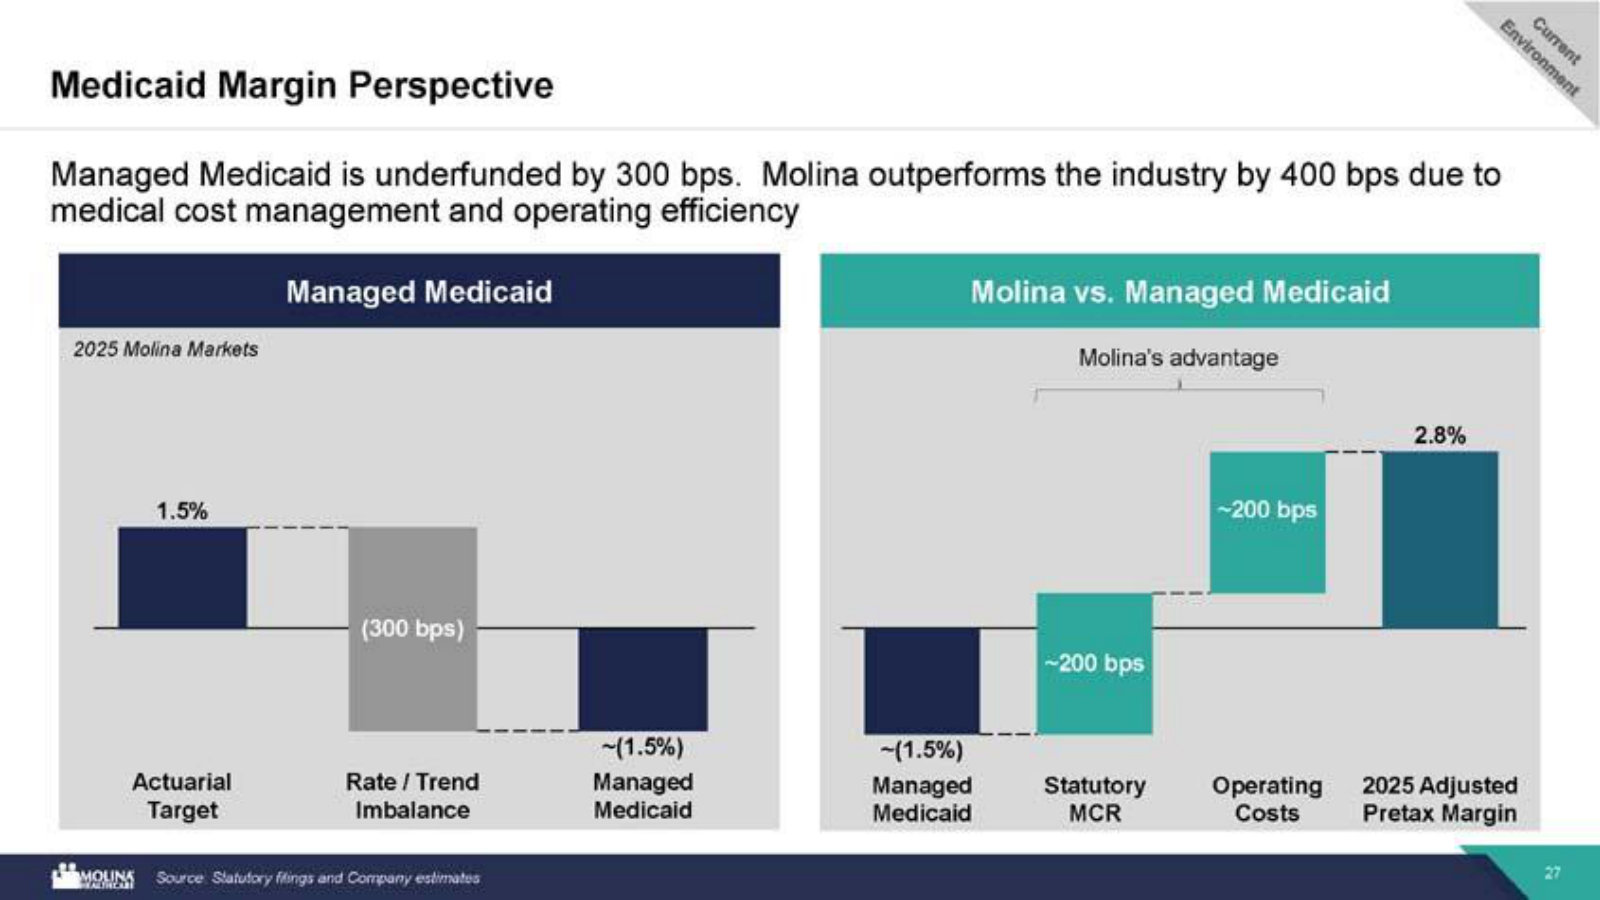
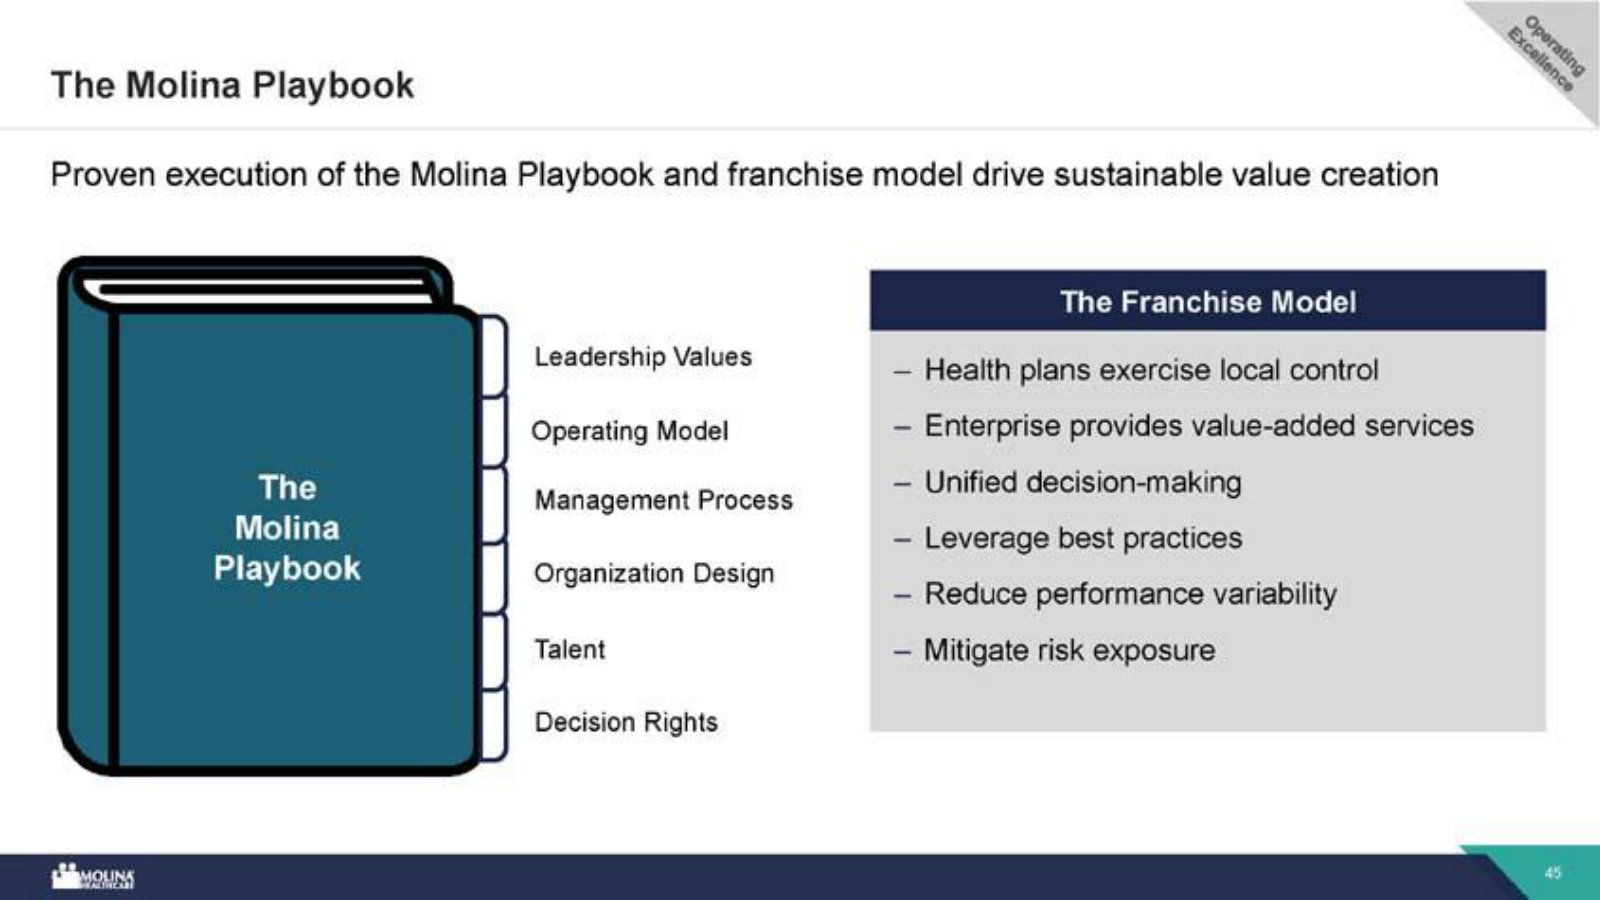
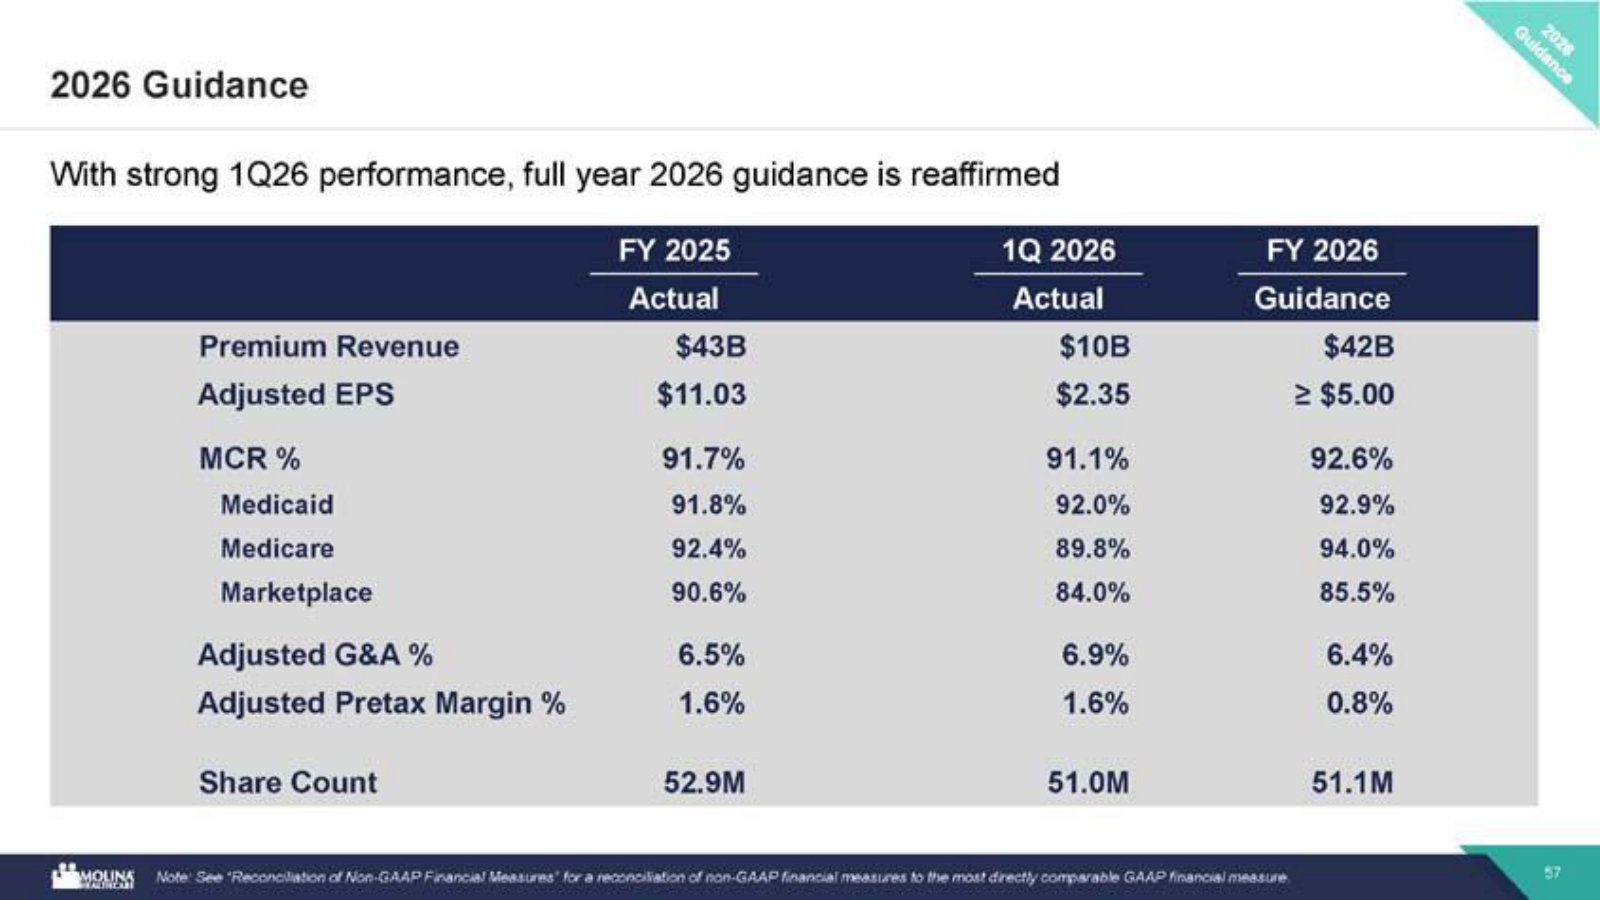
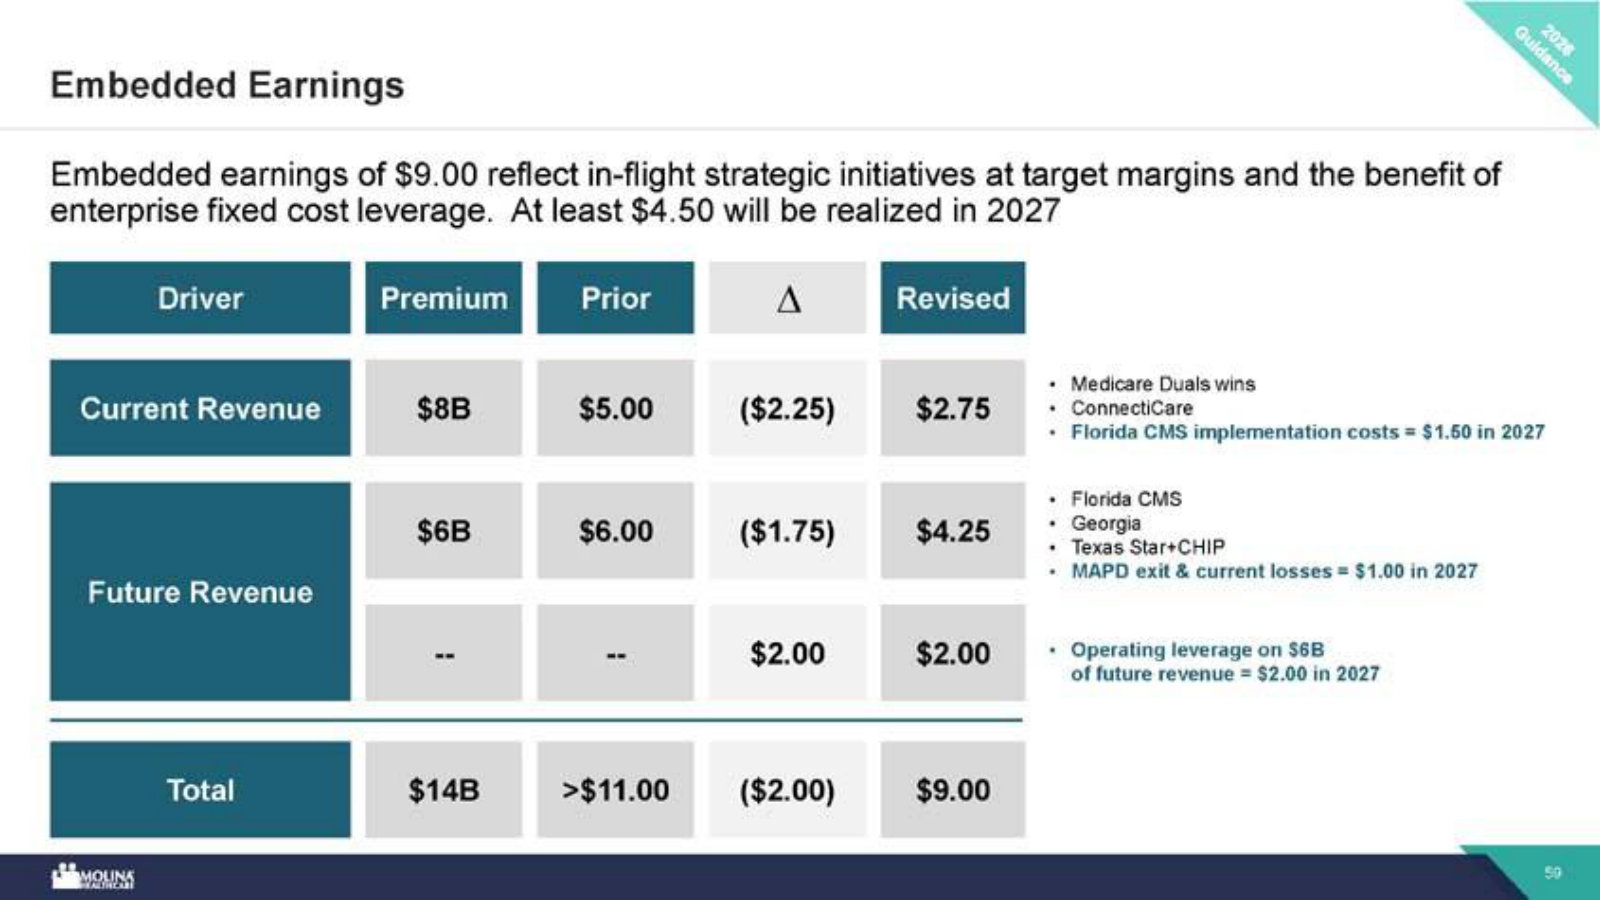
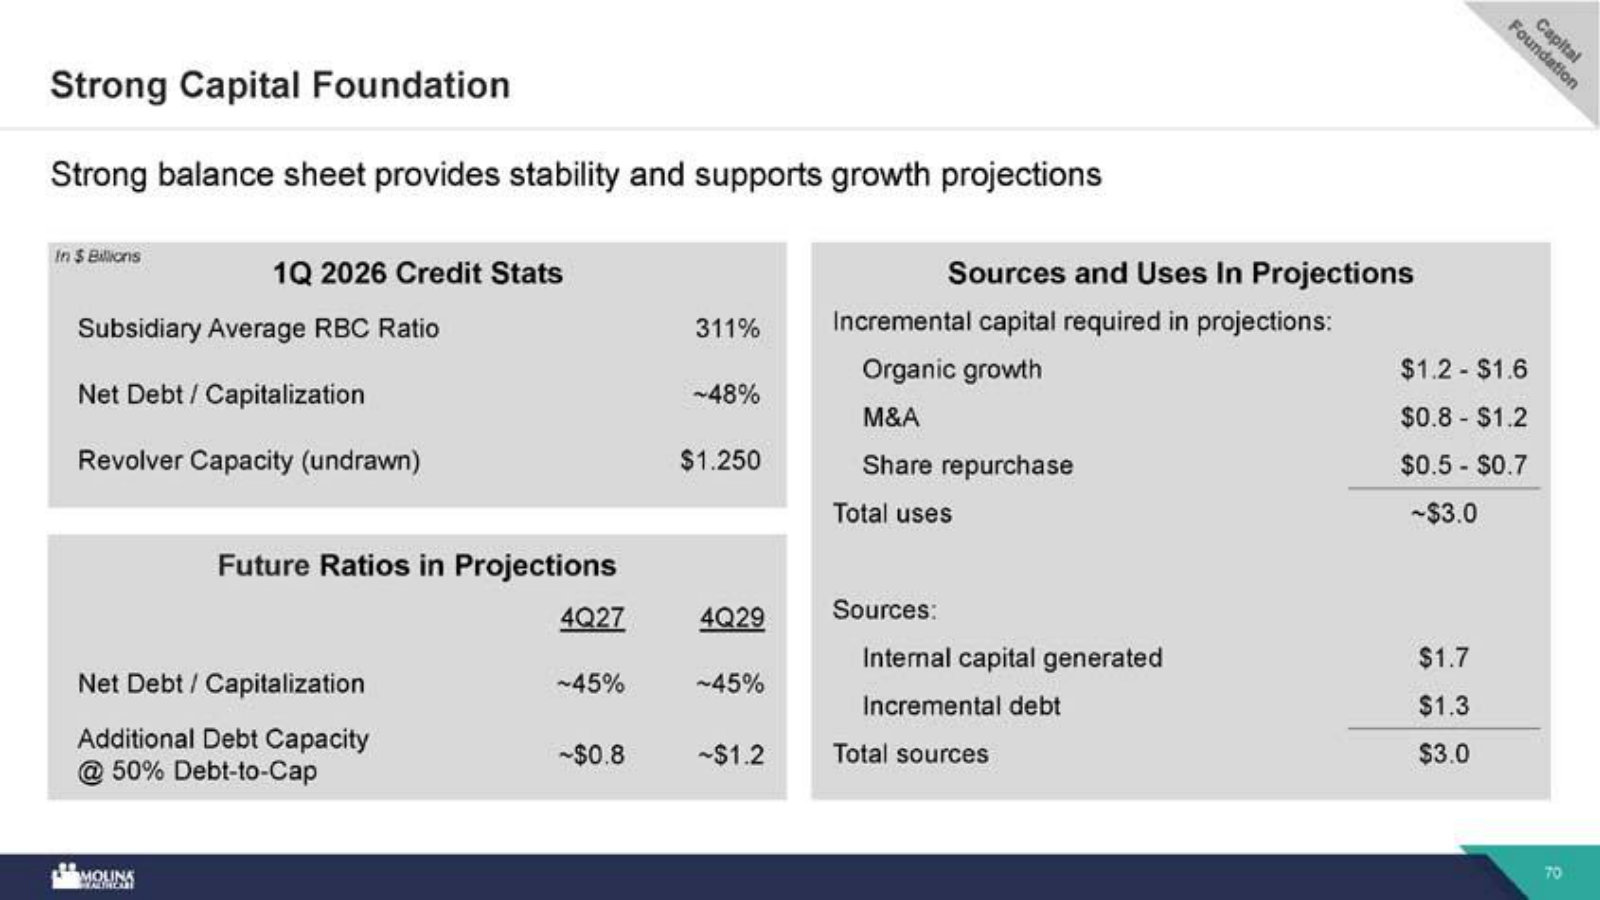
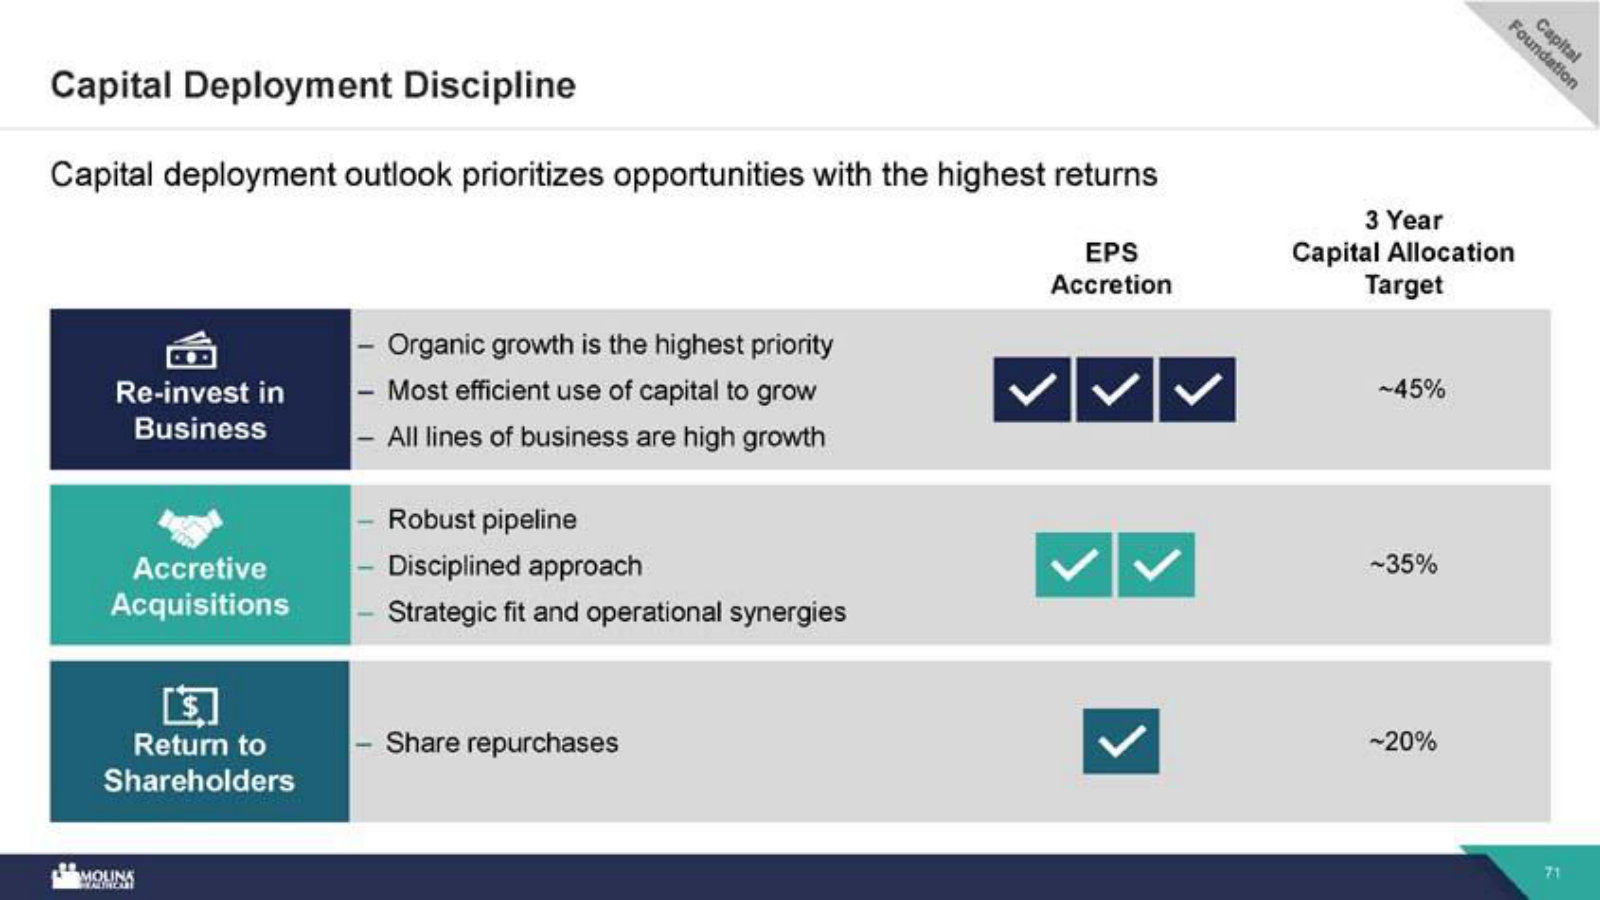
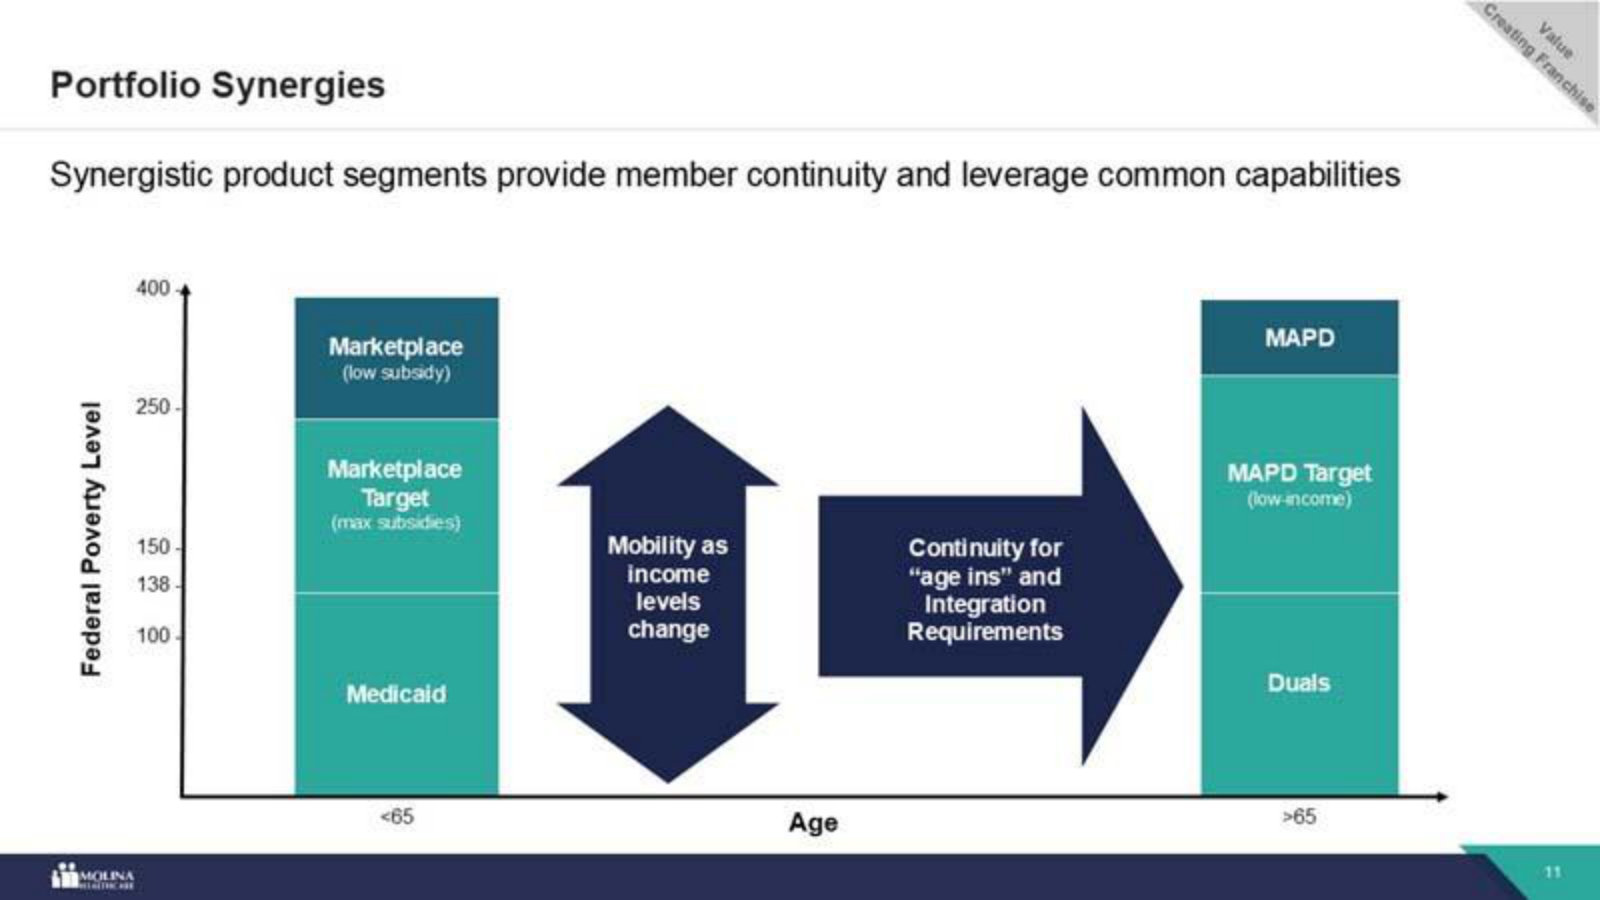
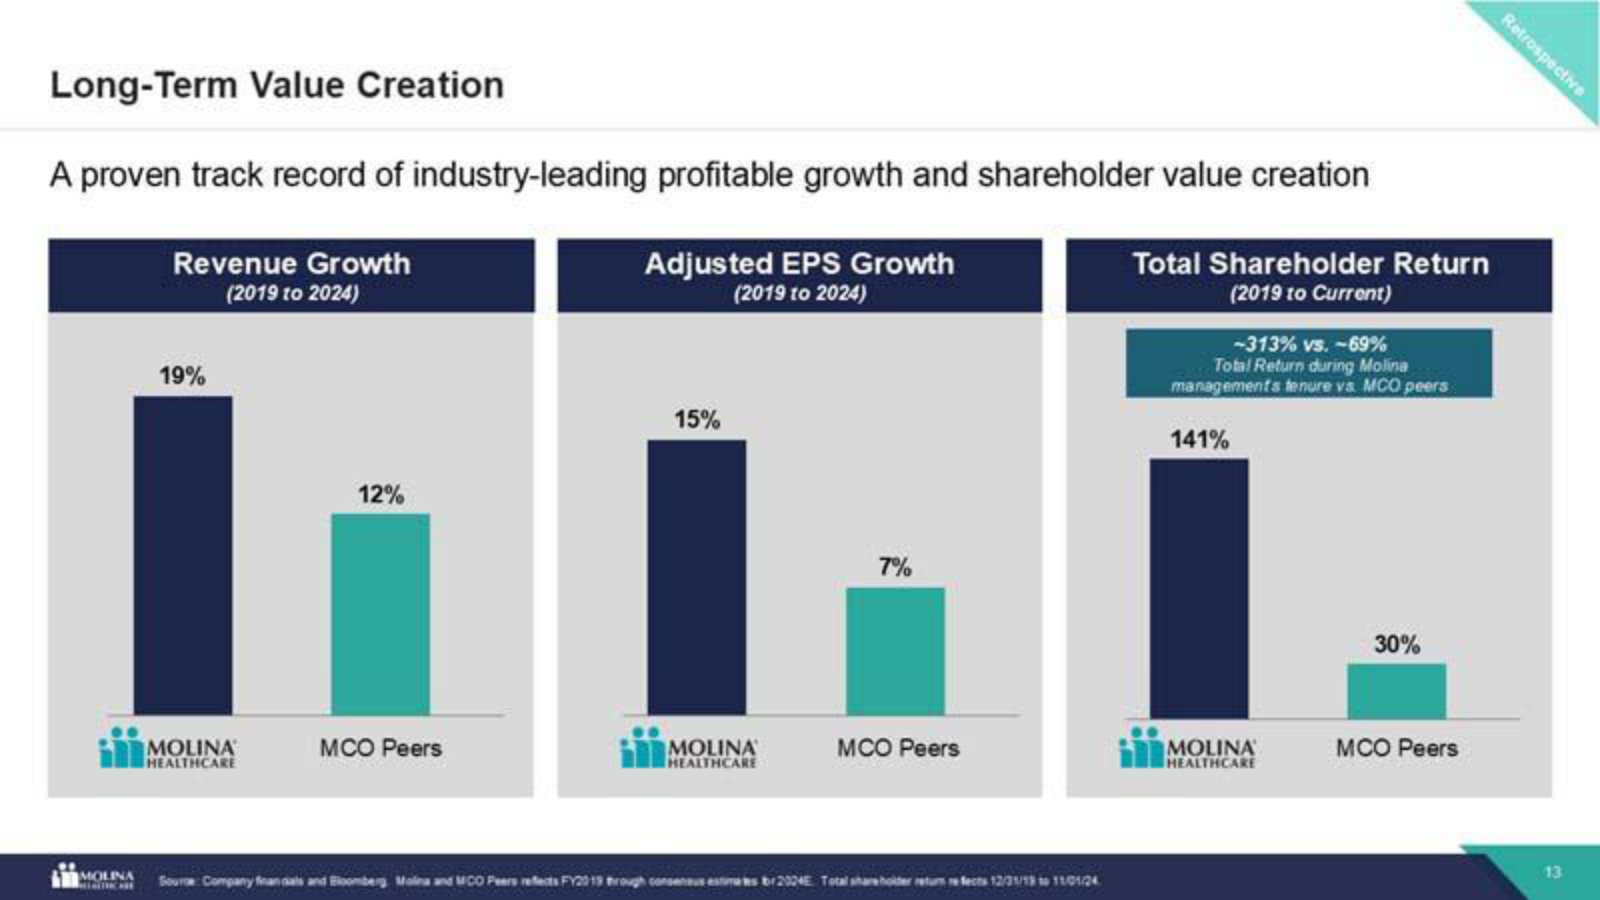
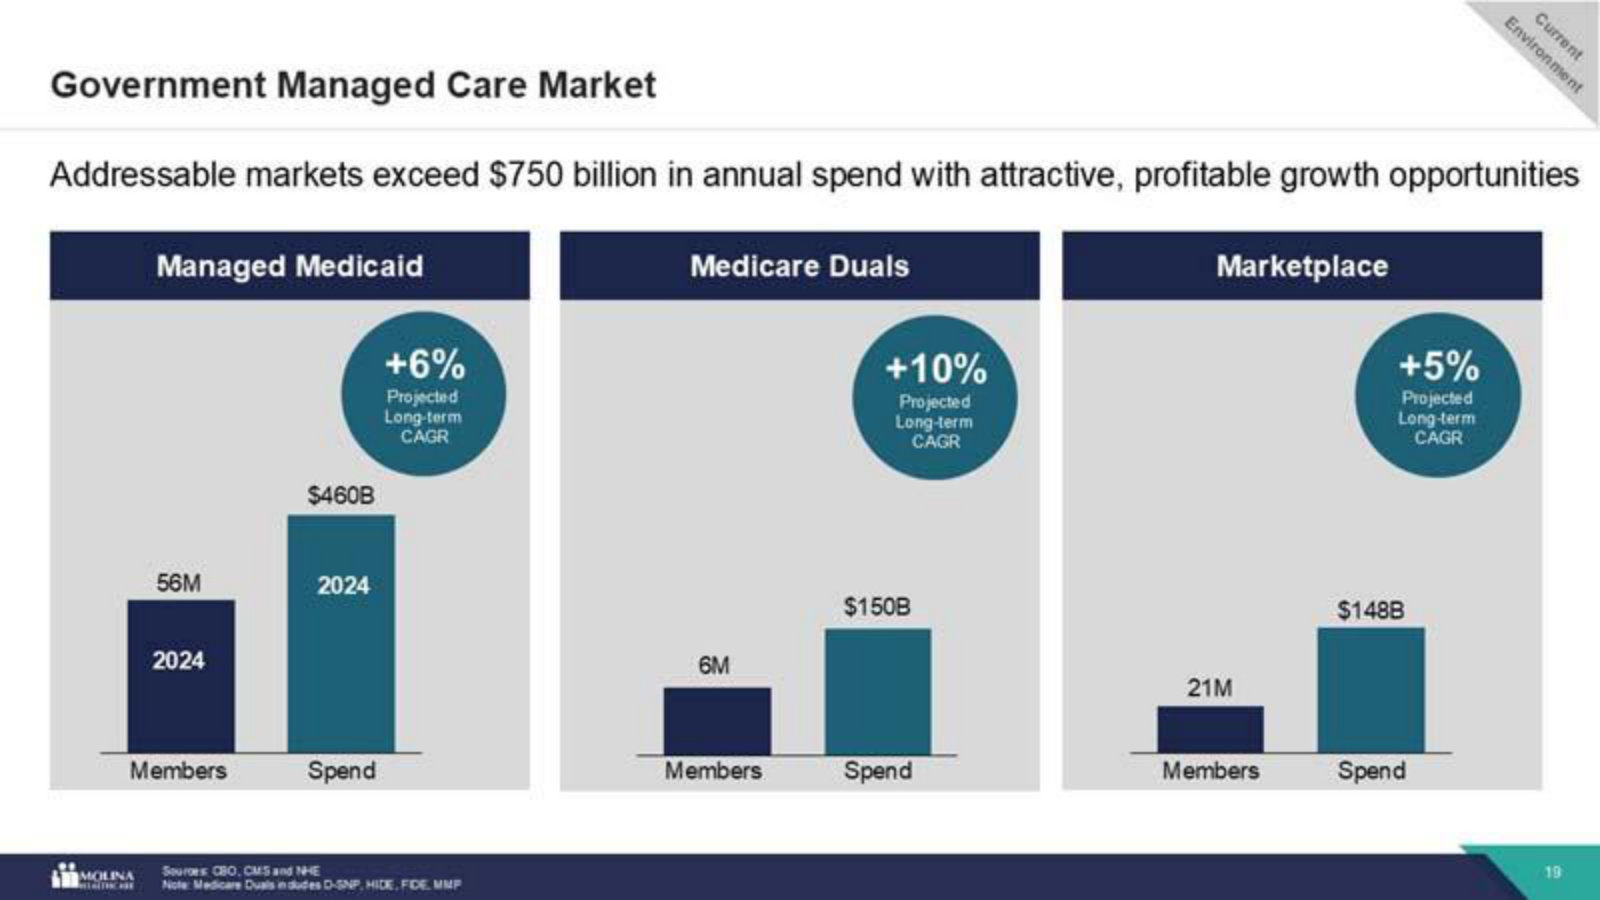
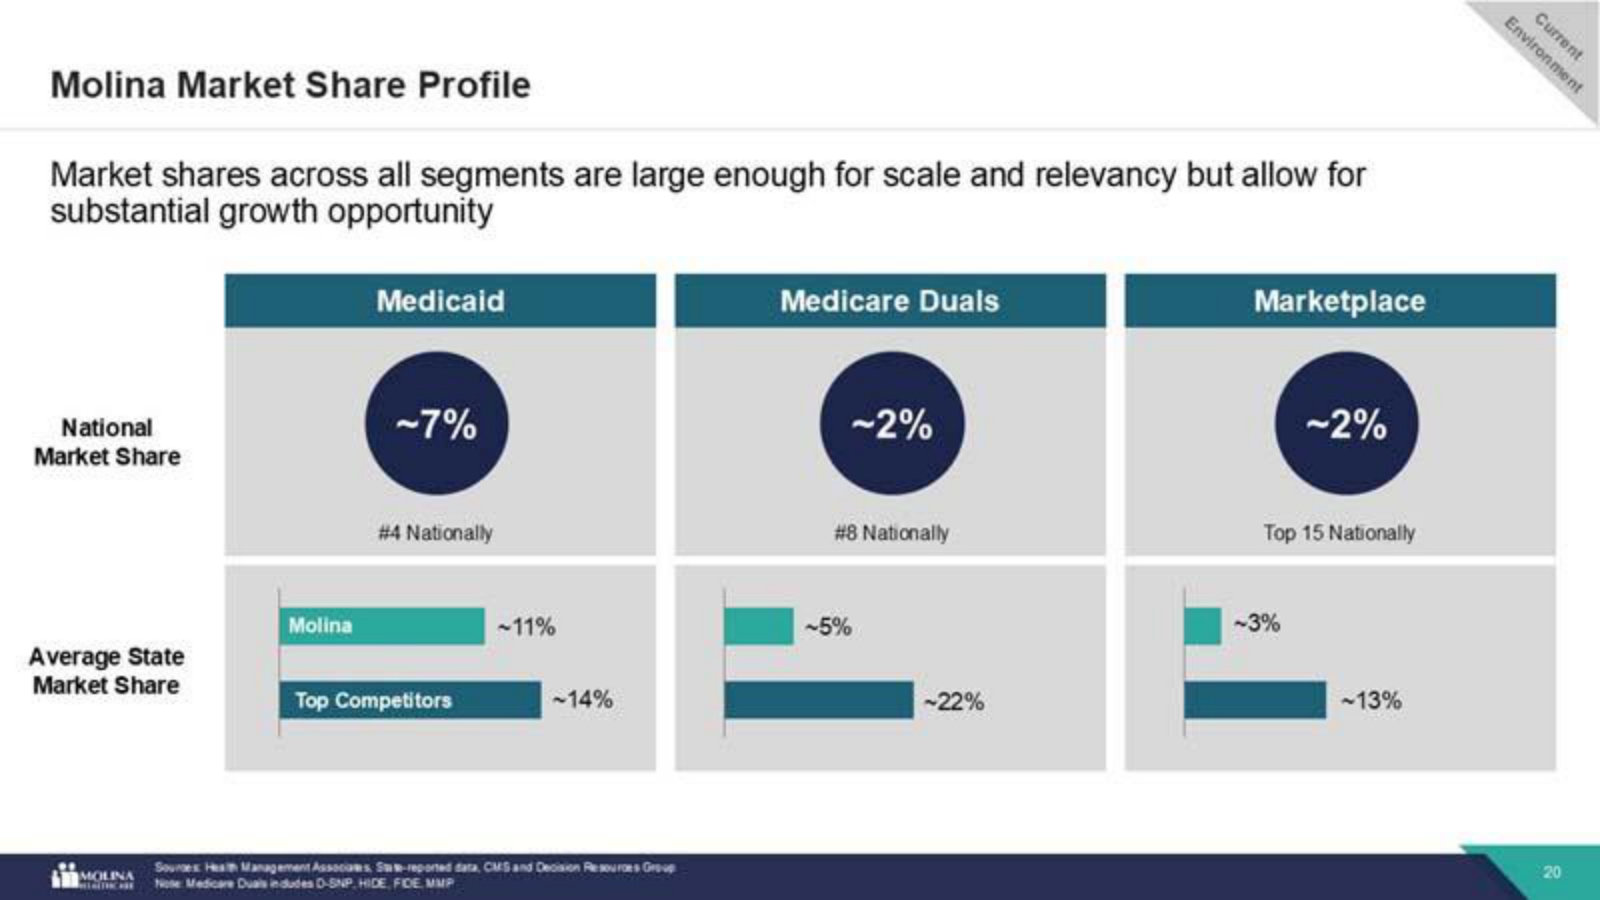
Molina Healthcare, Inc.'s management explains the business in its own materials. The slides below do the most of that work, pulled from the documents preserved in Sources. Each source link opens the complete presentation at that slide in a new tab.
Investor Day 2026 — 2026
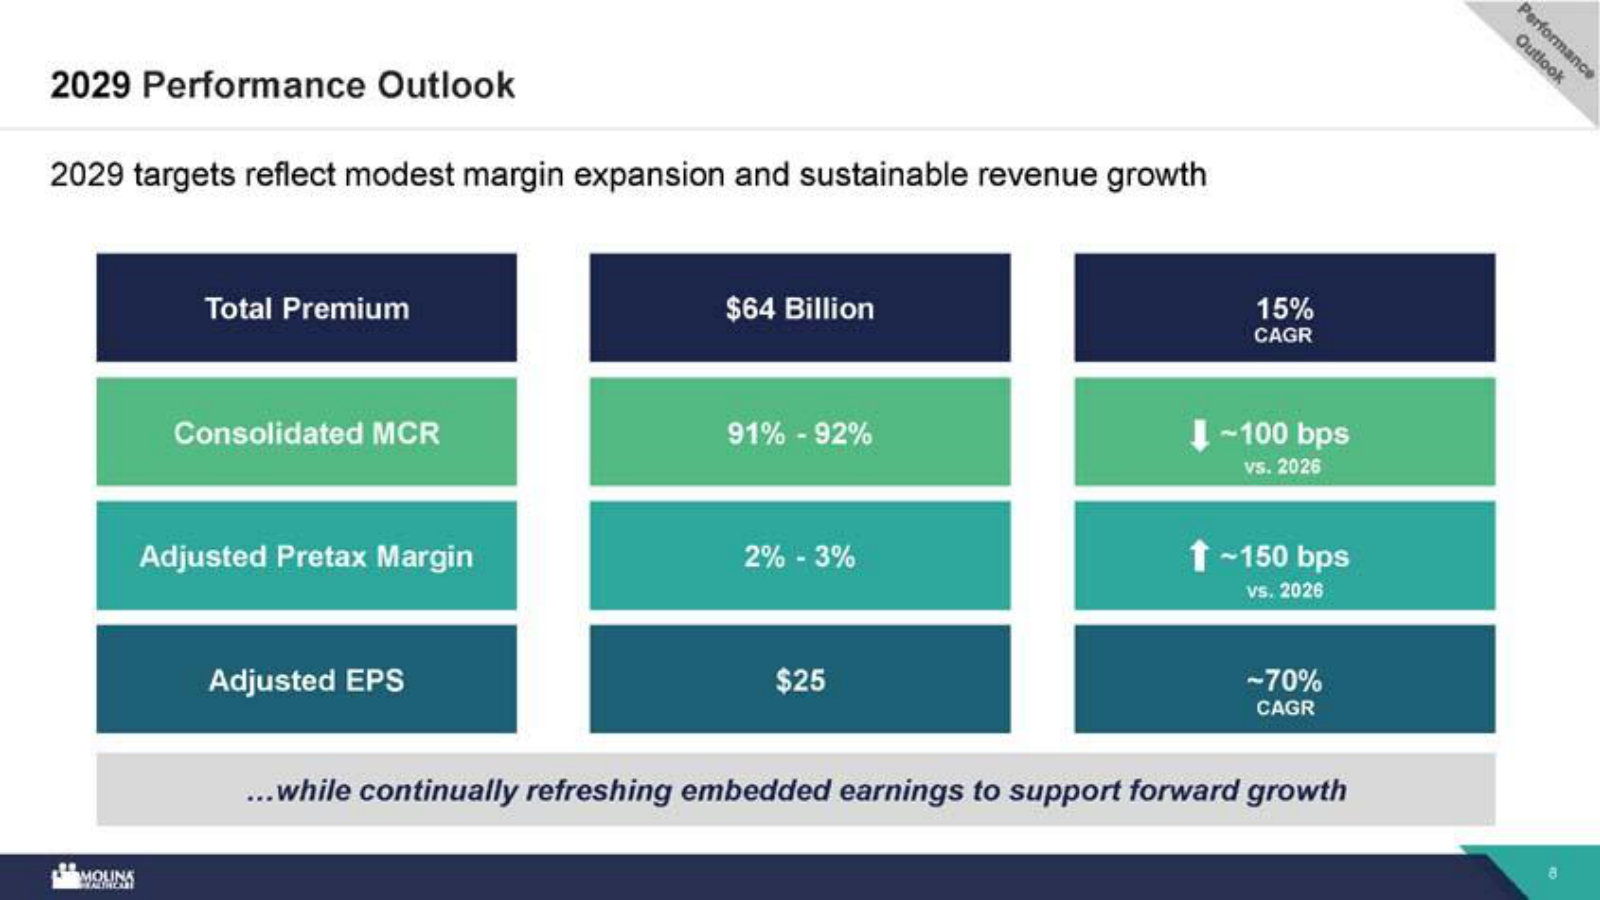
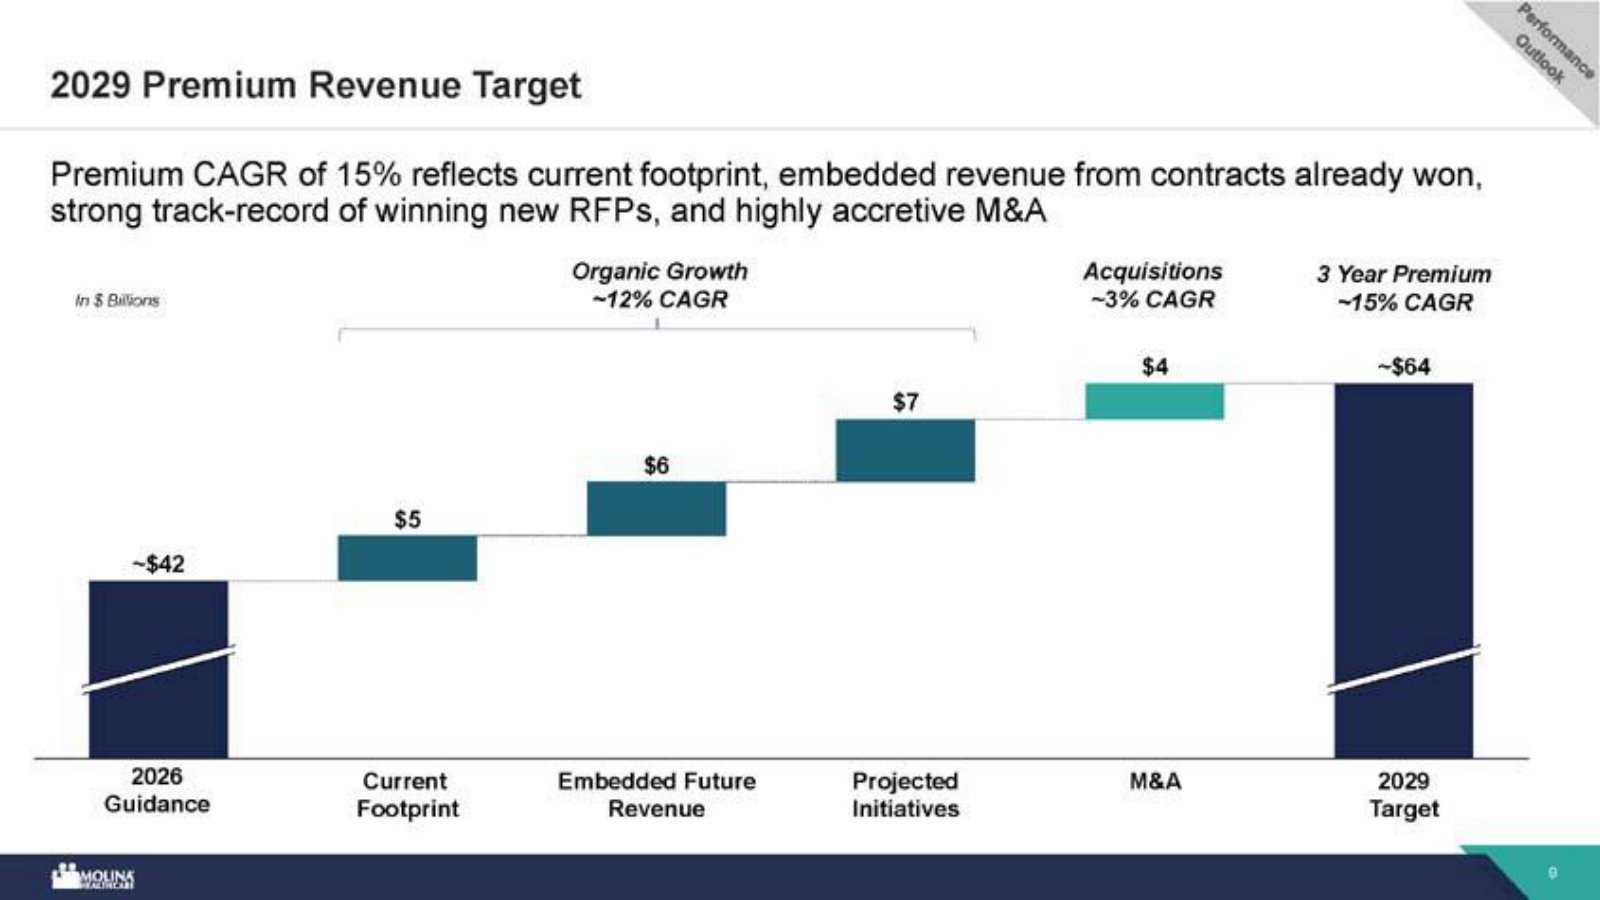
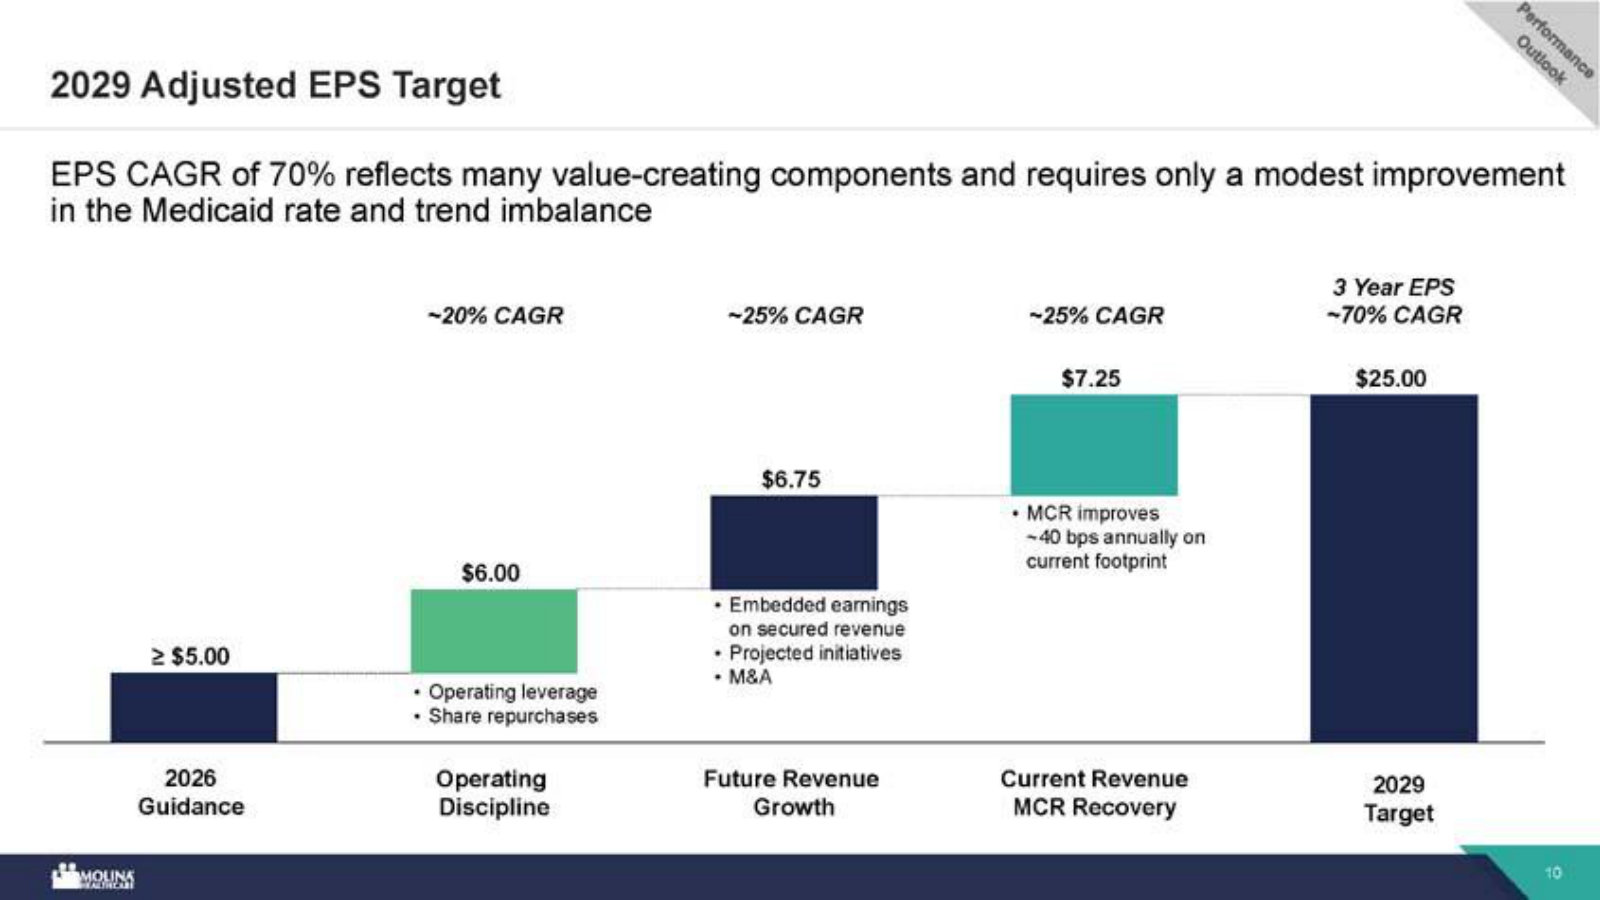
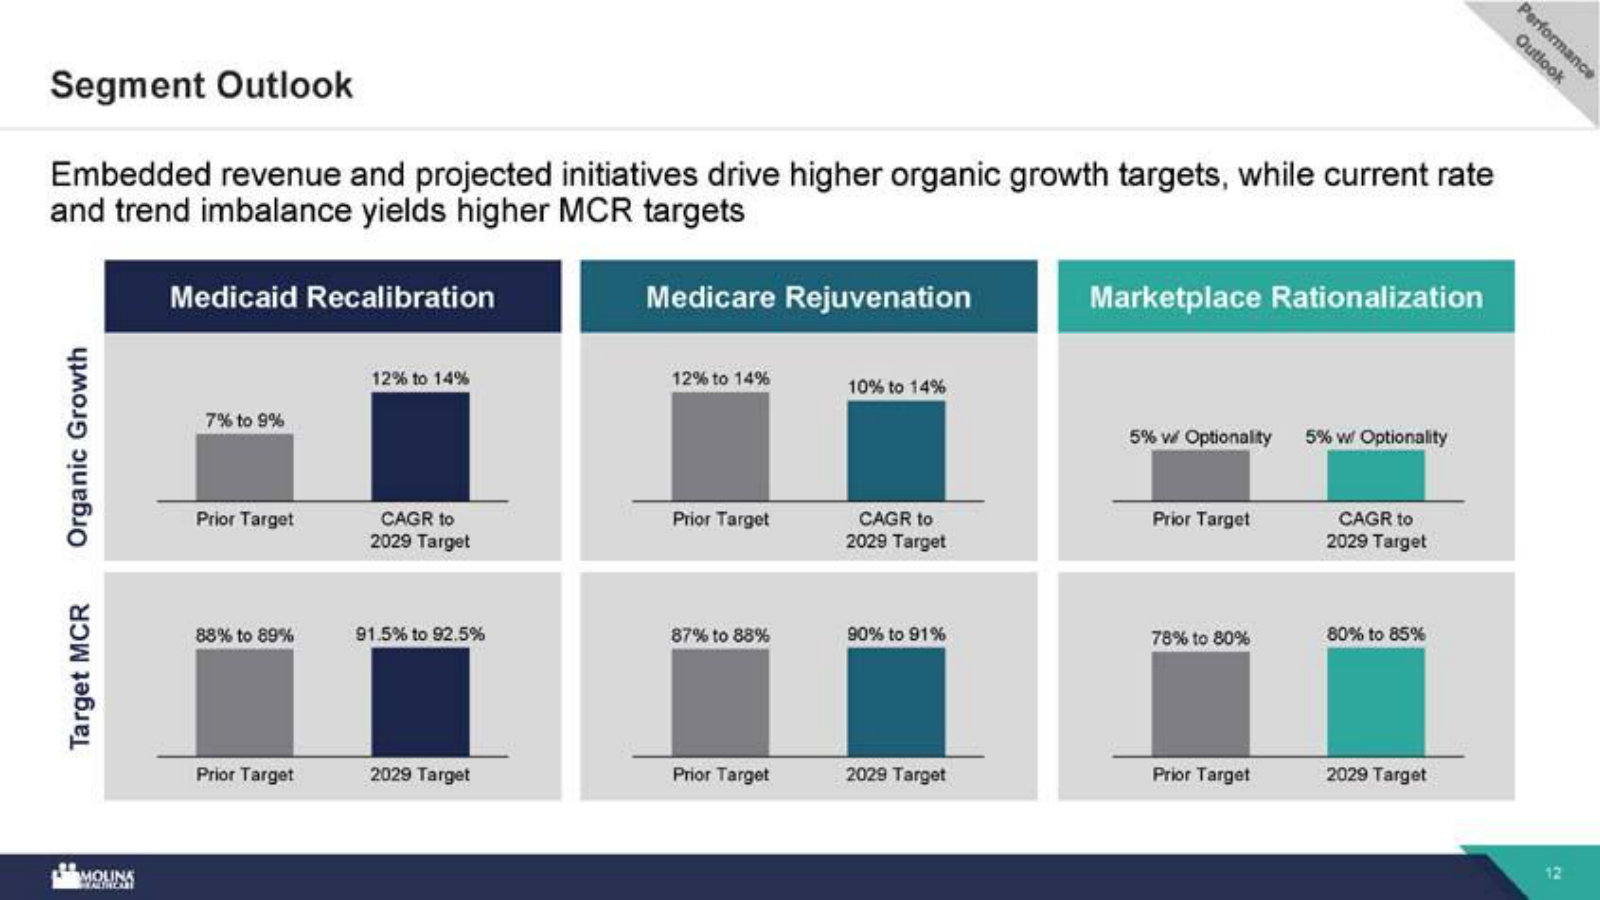
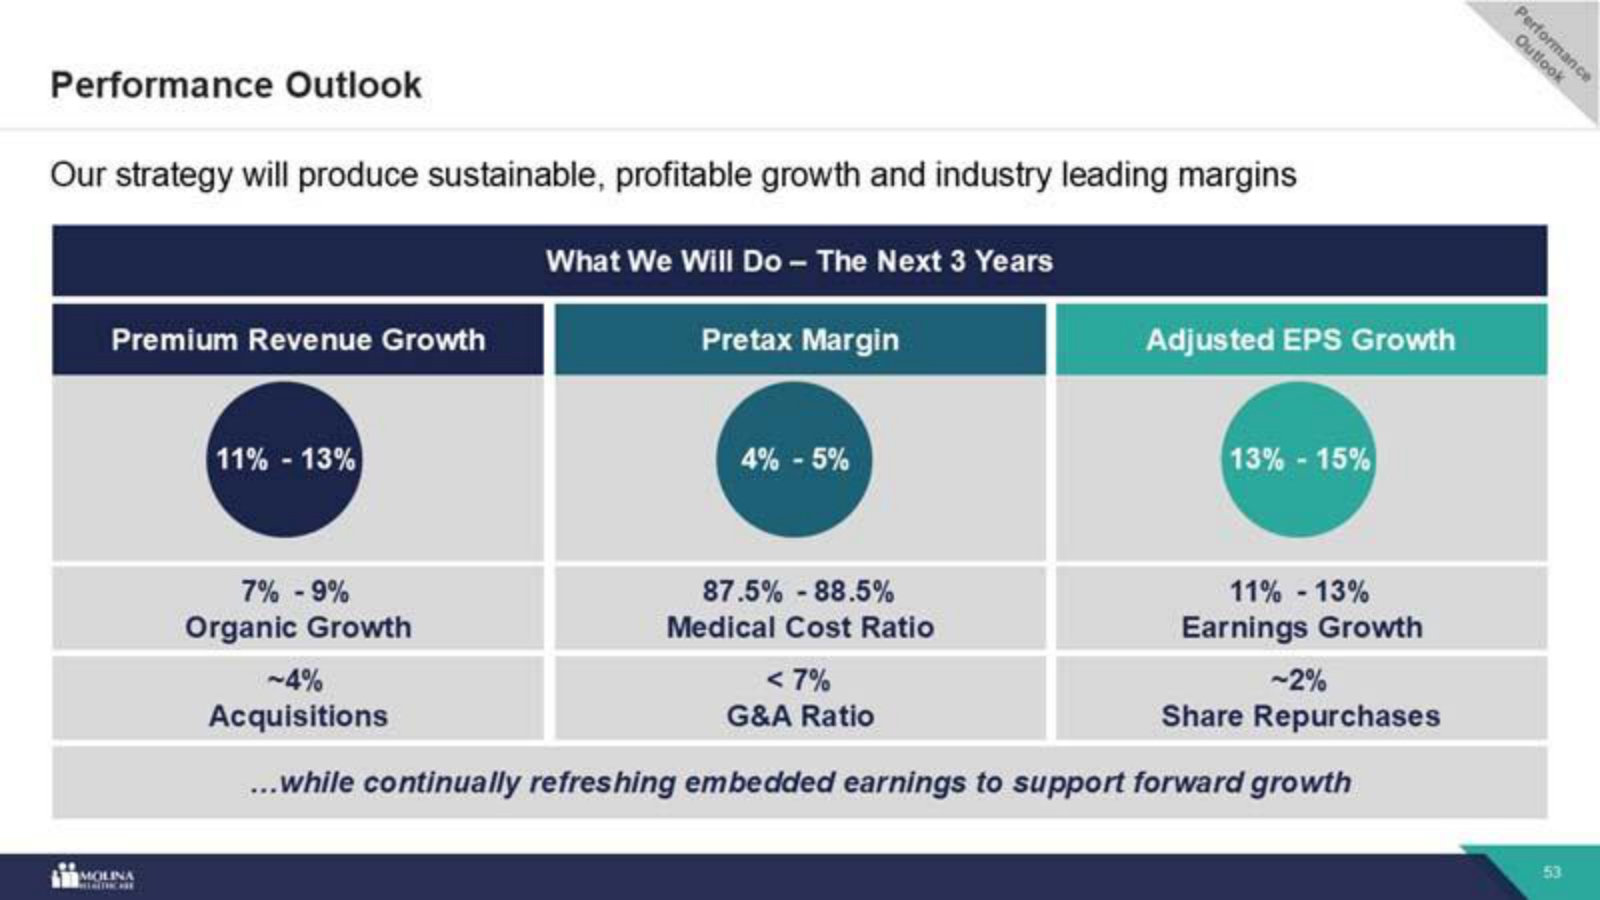
Management's fullest and most current statement of the business — franchise, segments, growth engines, the margin dislocation and the path to the 2029 targets. · Open the full document →
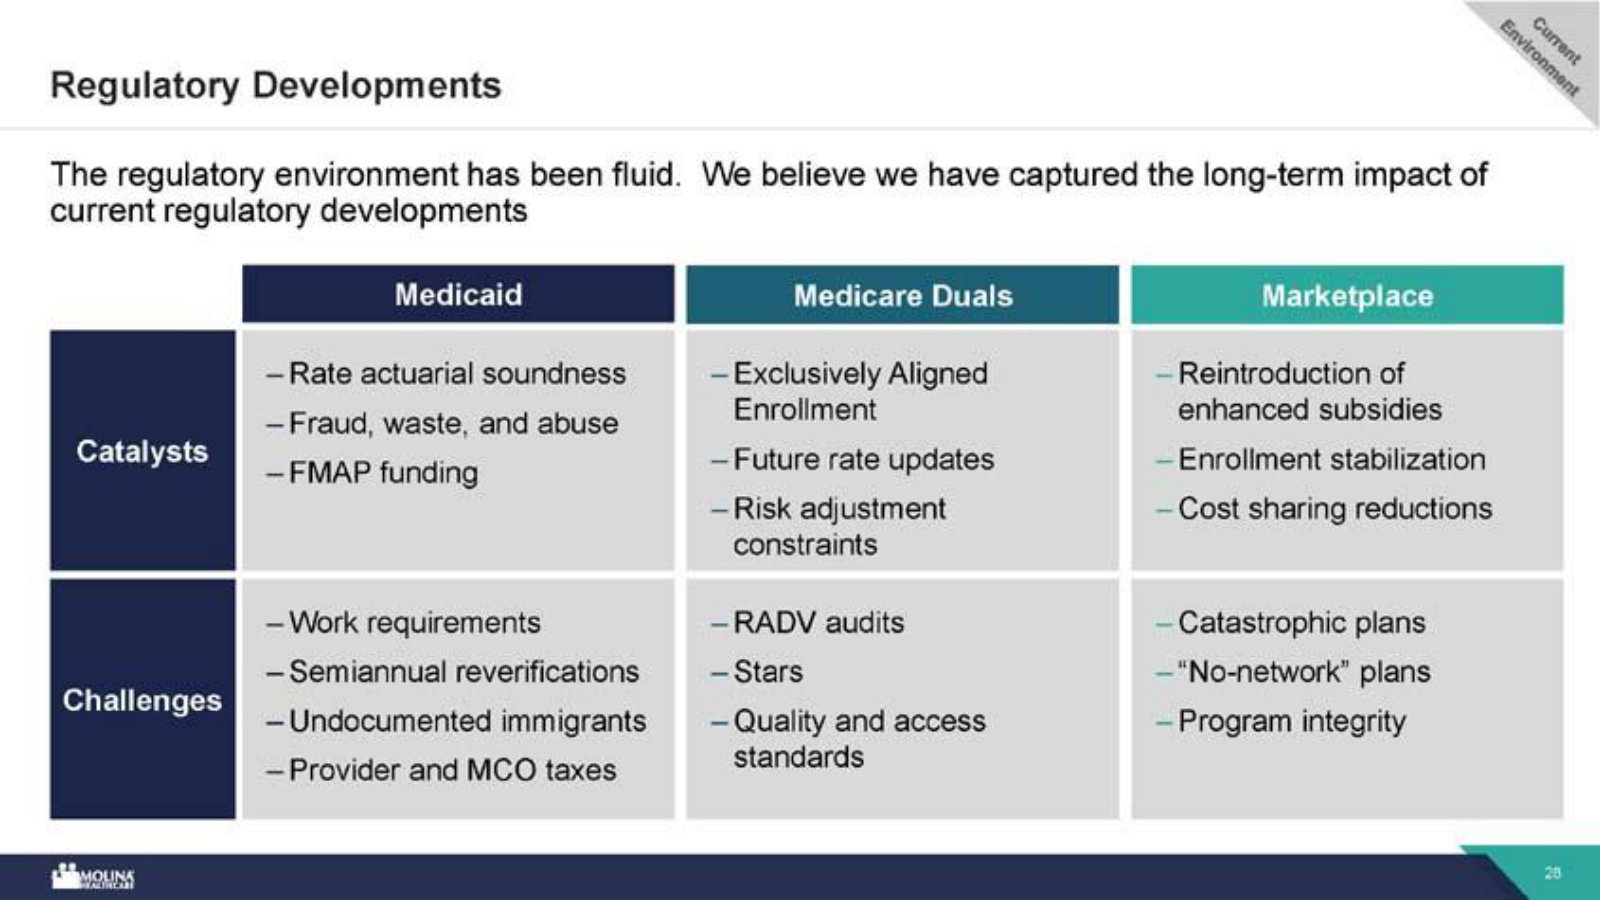
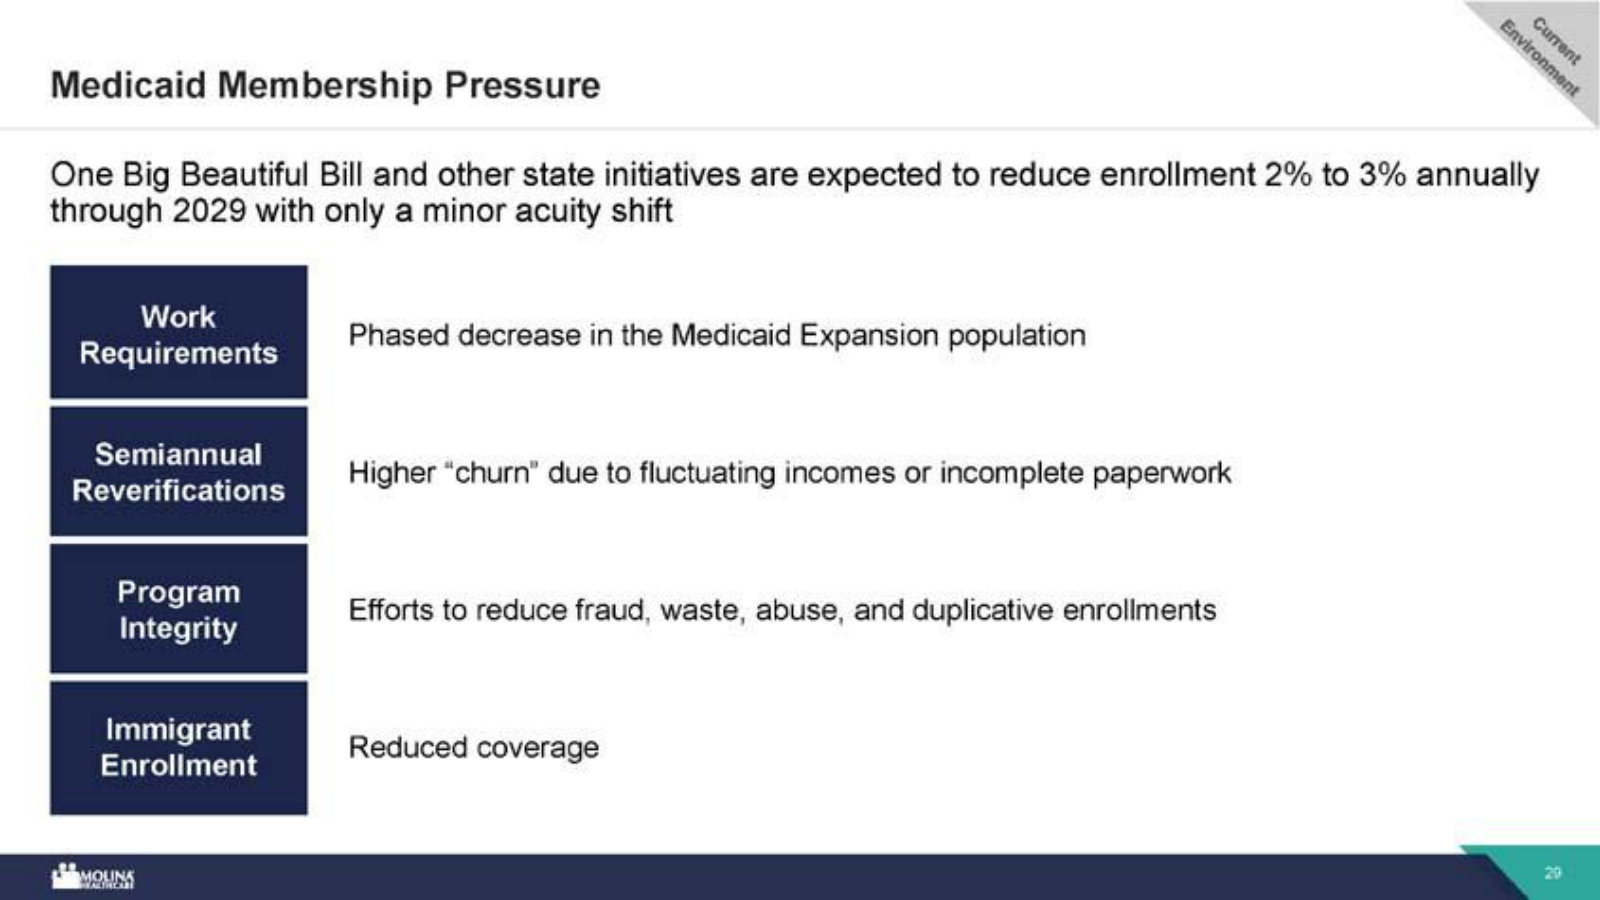
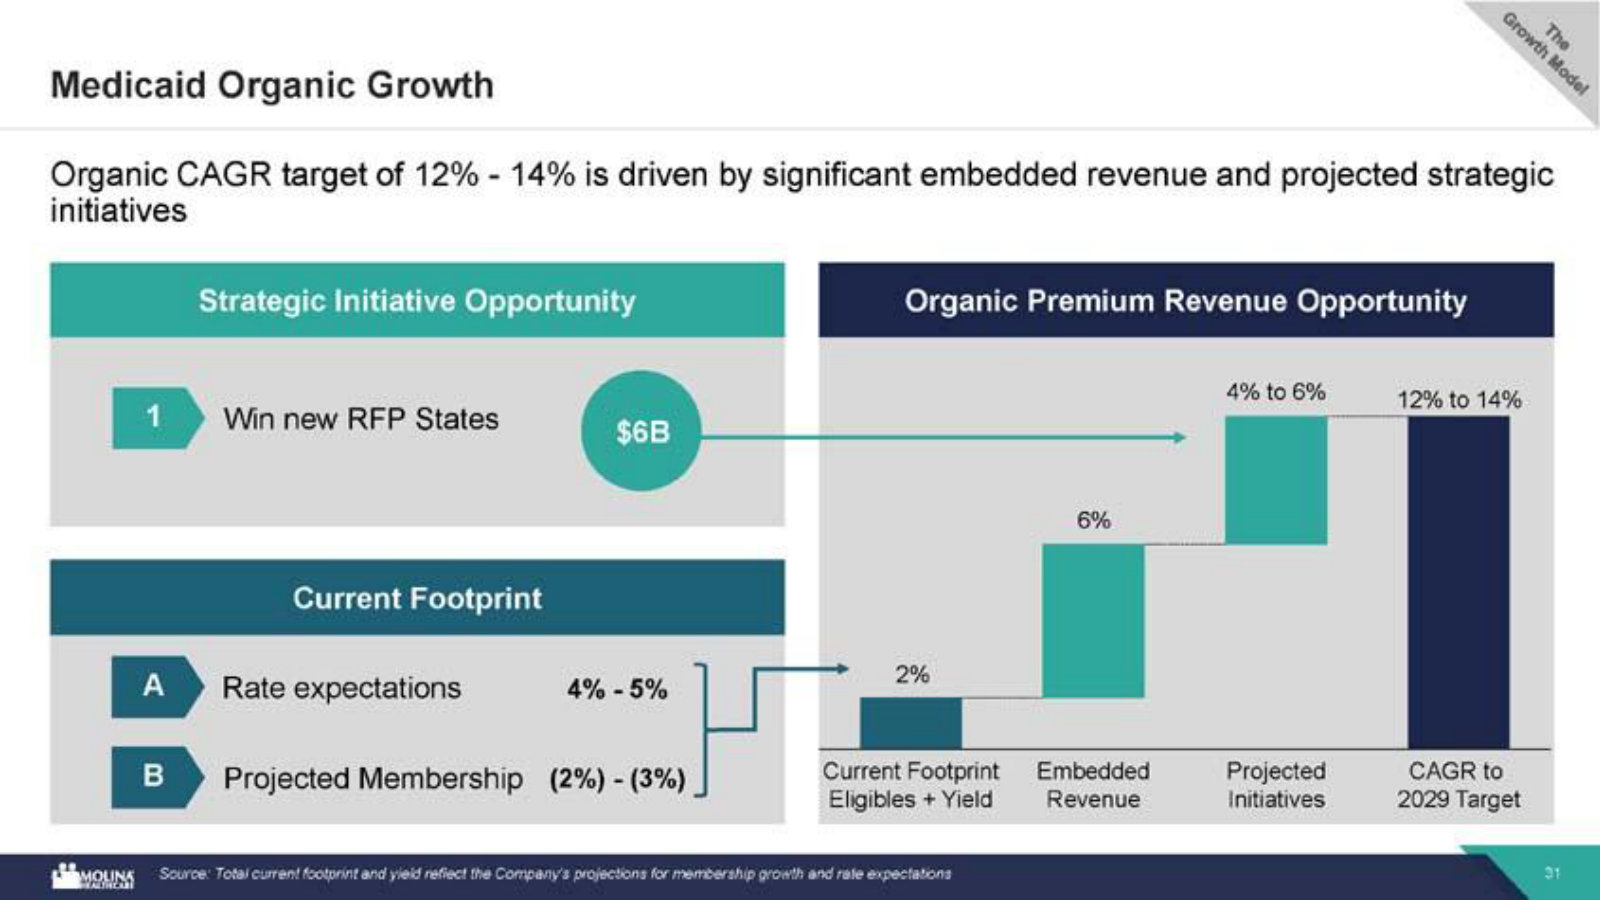
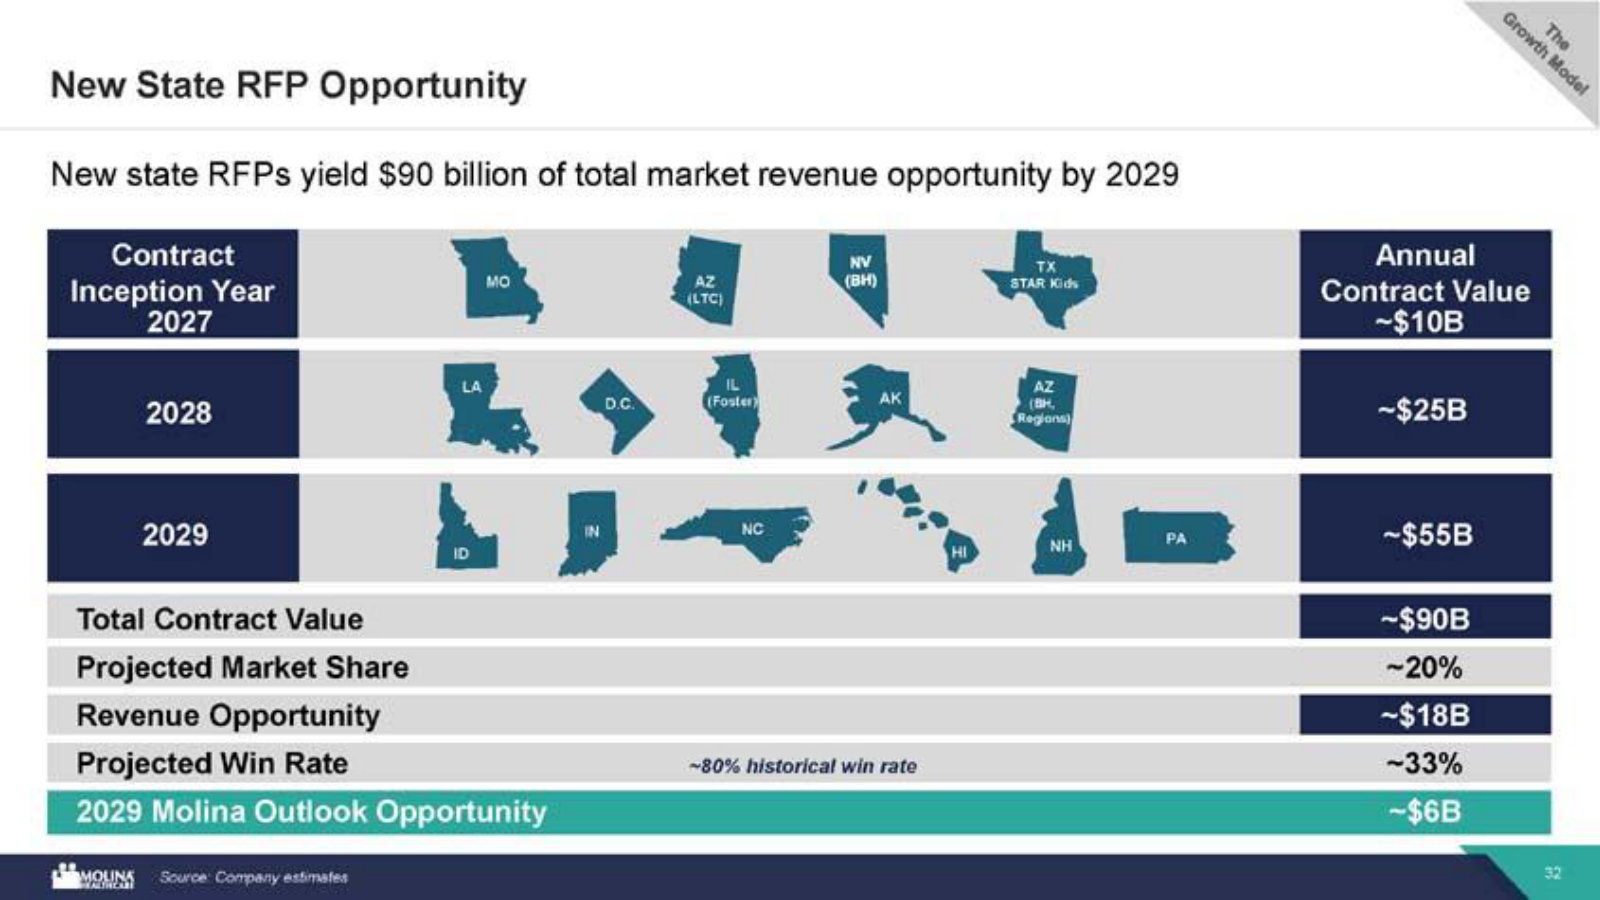
Investor Day 2024 — 2024
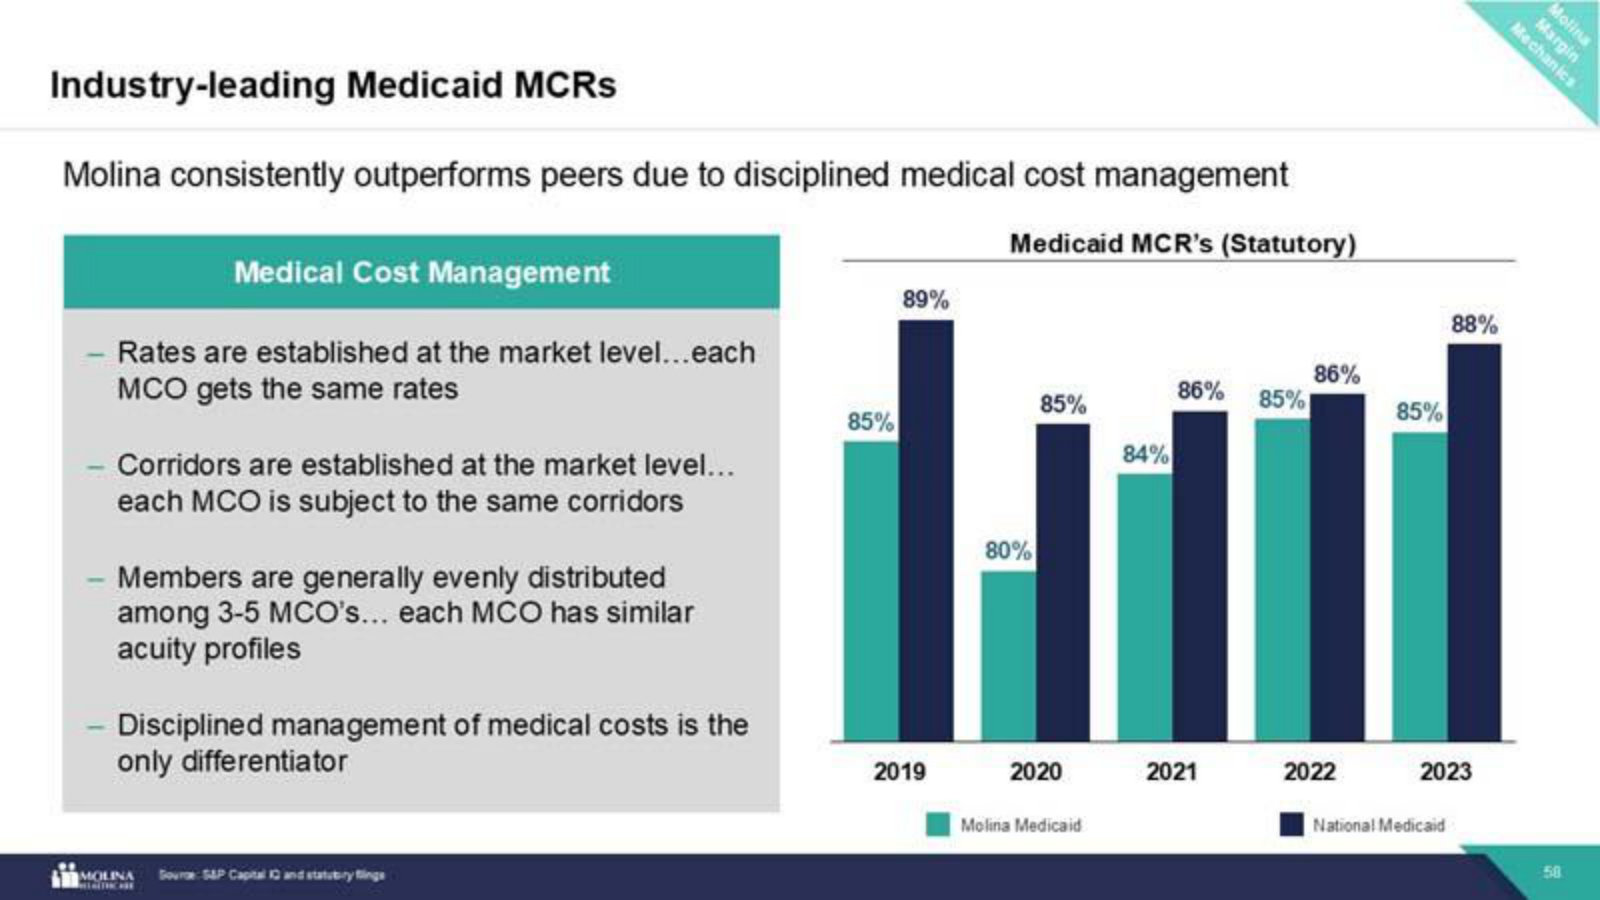
The prior investor day — best for market size, competitive position and the unit-economics of the MCR advantage that the 2026 deck assumes. · Open the full document →
More from management
Investor Day 2023 — 2023 · 79 pages · The earlier edition of this narrative, and where management first set the 2026 premium and EPS targets it is now measured against. · Open →
Molina Healthcare, Inc.'s management answers for the business every quarter. These are the exchanges that explain it best — verbatim, from the call transcripts preserved in Sources. Each link opens the full transcript at that page in a new tab.
Q1 FY2026 Earnings Call — Q1 FY2026 (Apr 2026)
The current state of the recovery: how management splits trend from acuity, why it is holding guidance, the Medicare-to-duals rebuild, and its M&A math. · Open the full transcript →
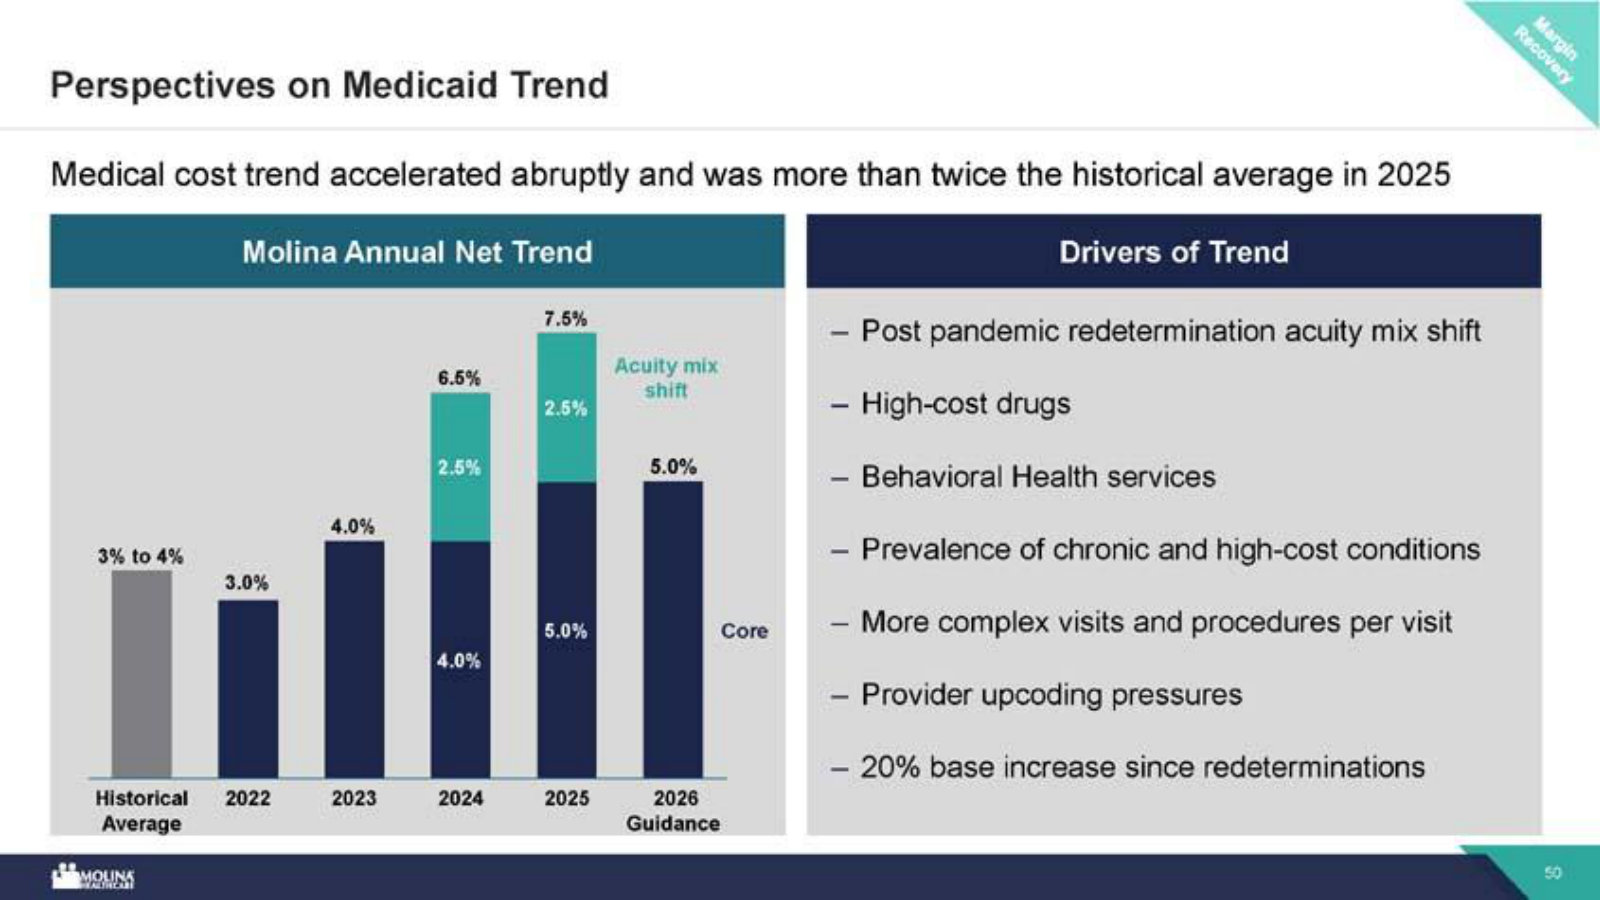
Splits 2025's 7.5% Medicaid trend into a one-time redetermination acuity shift and the 5% core carried into 2026.
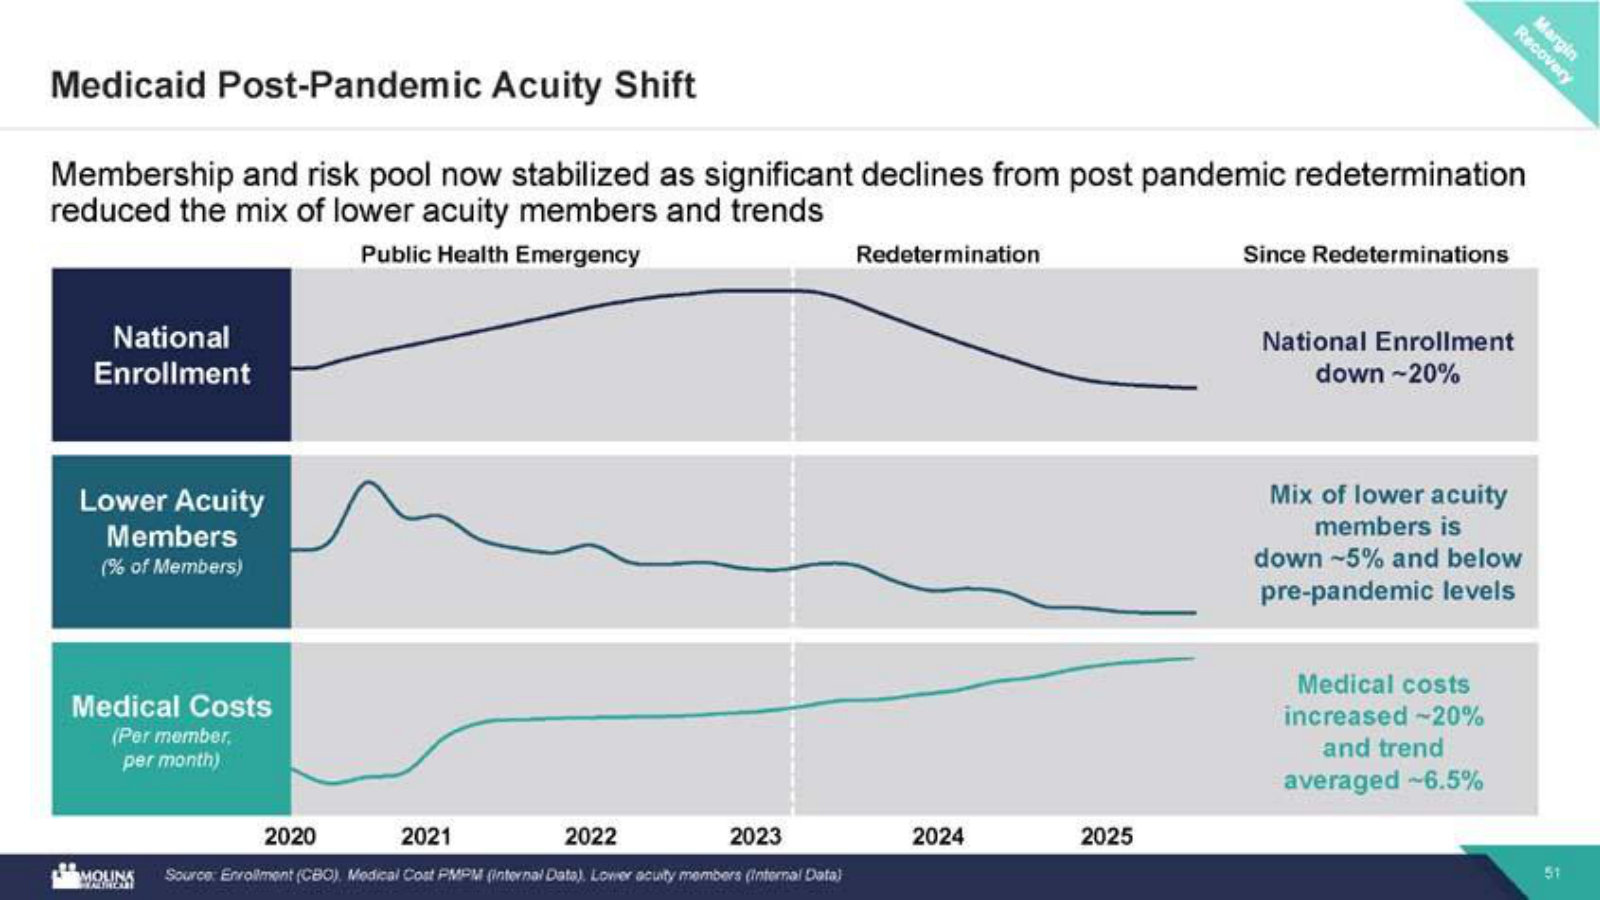
Joe Zubretsky, President & CEO: Last year, we observed a 7.5% medical cost trend that included 250 basis points of acuity shift related to the post-pandemic redetermination process. However, the acuity shift in core utilization impacts diminished as the year progressed. Our expectation that the acuity shift trend that we had experienced in 2025 was behind us and would not recur is holding up. We feel confident in our 5% medical cost trend assumption for 2026.
p. 1 · Read in context →
Asked why not raise guidance after a strong quarter, he explains the prudence and the loss-ratio cushion in the full-year number.
Joe Zubretsky, President & CEO (responding to Kevin Fischbeck, Bank of America): We use the term time tested because I think it is prudent to see 6 months of results before updating our guidance, particularly coming off a highly volatile medical cost inflection environment in 2025, bearing in mind in Medicaid with a 92% result in the first quarter a 92.9% indication in our guidance for the full year, we can actually produce loss ratios north of 93% and still hit our guidance for the rest of the year. So cautious perhaps, but in this environment, we think it's entirely prudent to do so.
p. 5 · Read in context →
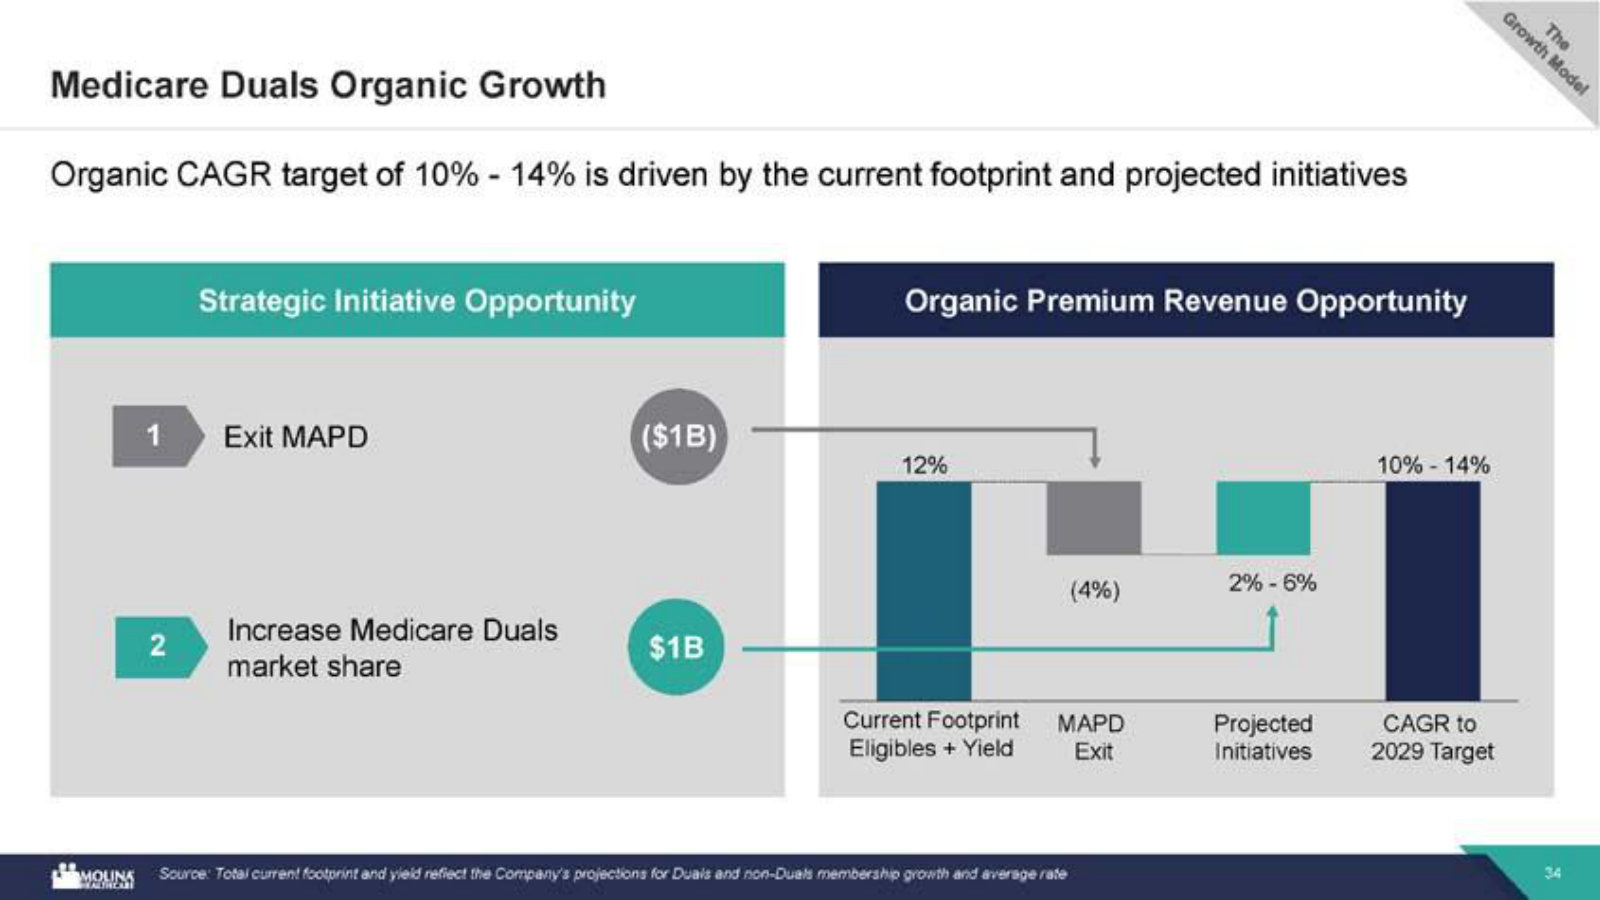
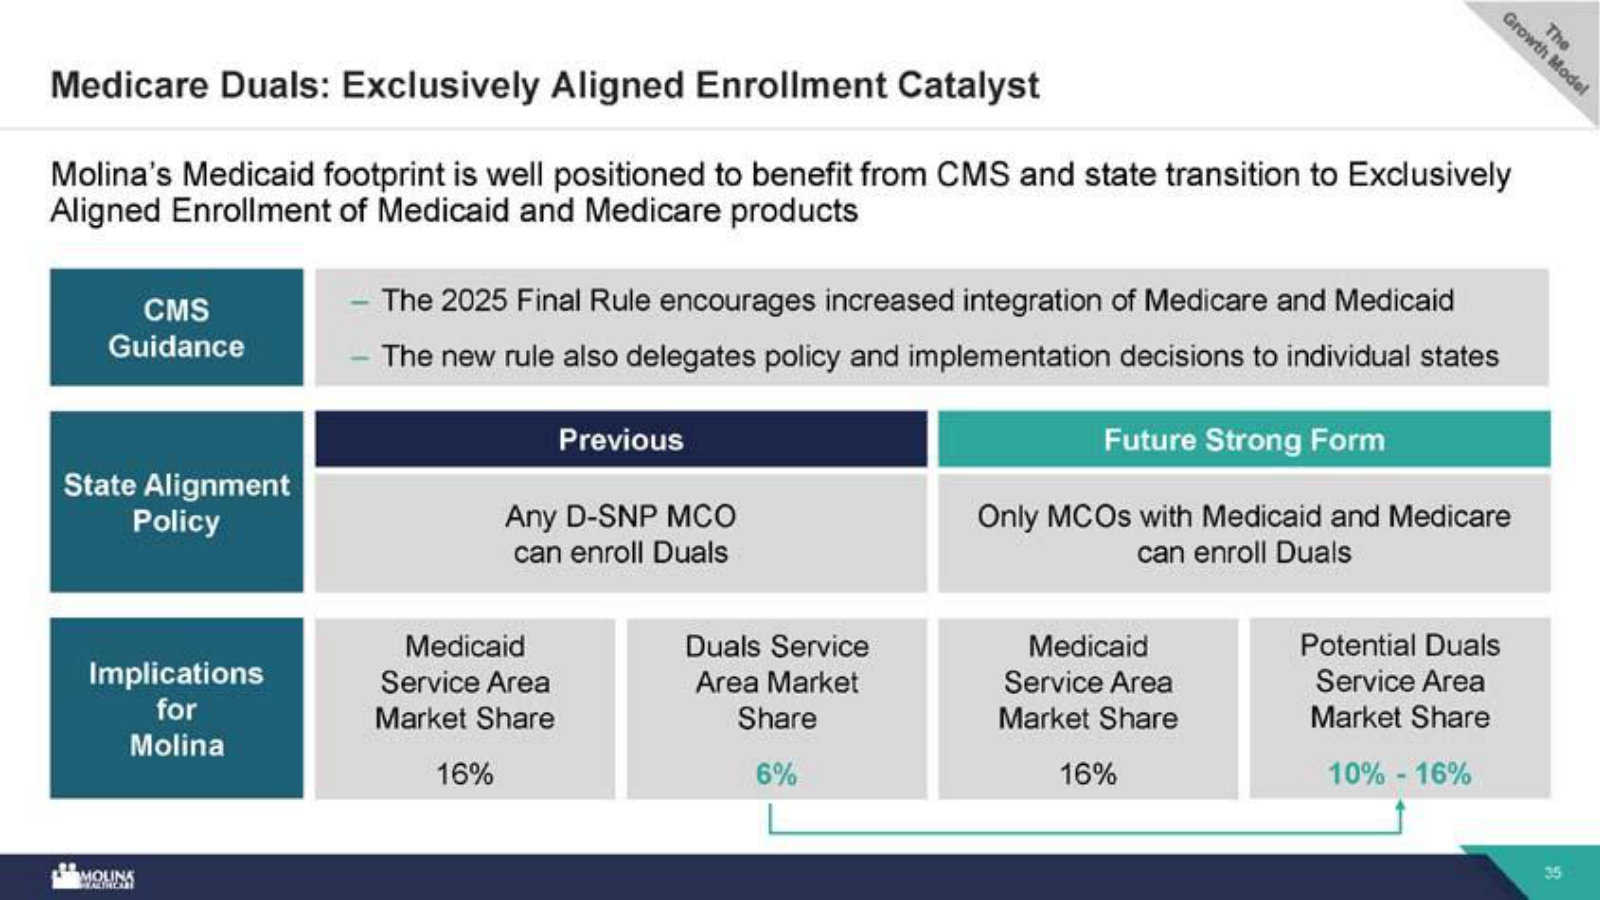
Lays out the Medicare rebuild — D-SNP, the MMP-to-HIDE/FIDE conversion, and the MAPD exit — into a pure duals business.
Scott Fidel (Goldman Sachs), analyst; Joe Zubretsky, President & CEO: You're right to point out that the Medicare story is a little more complicated than most because it's a combination of our D-SNP product, which has been in force for many years; our MMP members who have now converted to HIDE and FIDE; and our MAPD product, which we are going to eliminate for 2027. We cited a drag on this year's earnings due to the MAPD product — I think we said it produced about a $1 earnings per share drag that won't repeat next year — and it is tracking to plan. D-SNPs have always produced a modest profit and continue to.
p. 8 · Read in context →
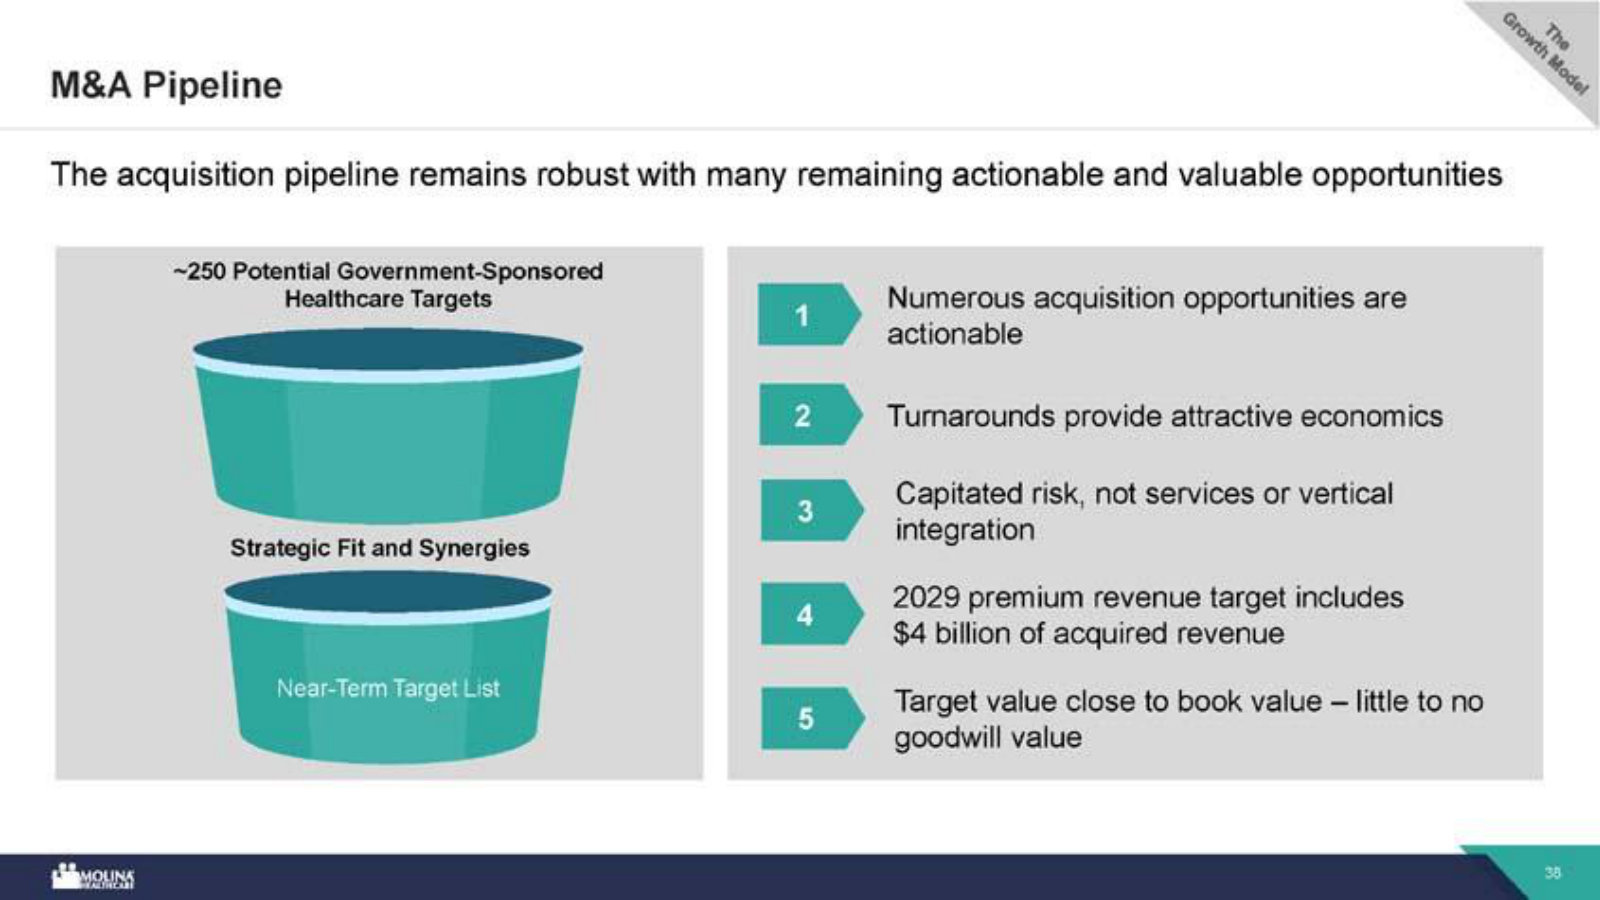
M&A capital allocation: buying plans near book value can beat a new contract win when you're mostly paying for regulatory capital.
John Stansel (JPMorgan), analyst; Joe Zubretsky, President & CEO: Our M&A pipeline is full of actionable opportunities. We'll remain disciplined and focus on properties that fit our core strategy. Mark and I debate this often: historically we paid around 22 to 23 percent of revenue, but book value now seems the best benchmark. If you're only paying for regulatory capital, an M&A deal can be as good as, if not better than, a new contract win.
p. 9 · Read in context →
The recovery math: a cost base 20% above three years ago, states catching up on rates, Molina running 300-400 bps better than market.
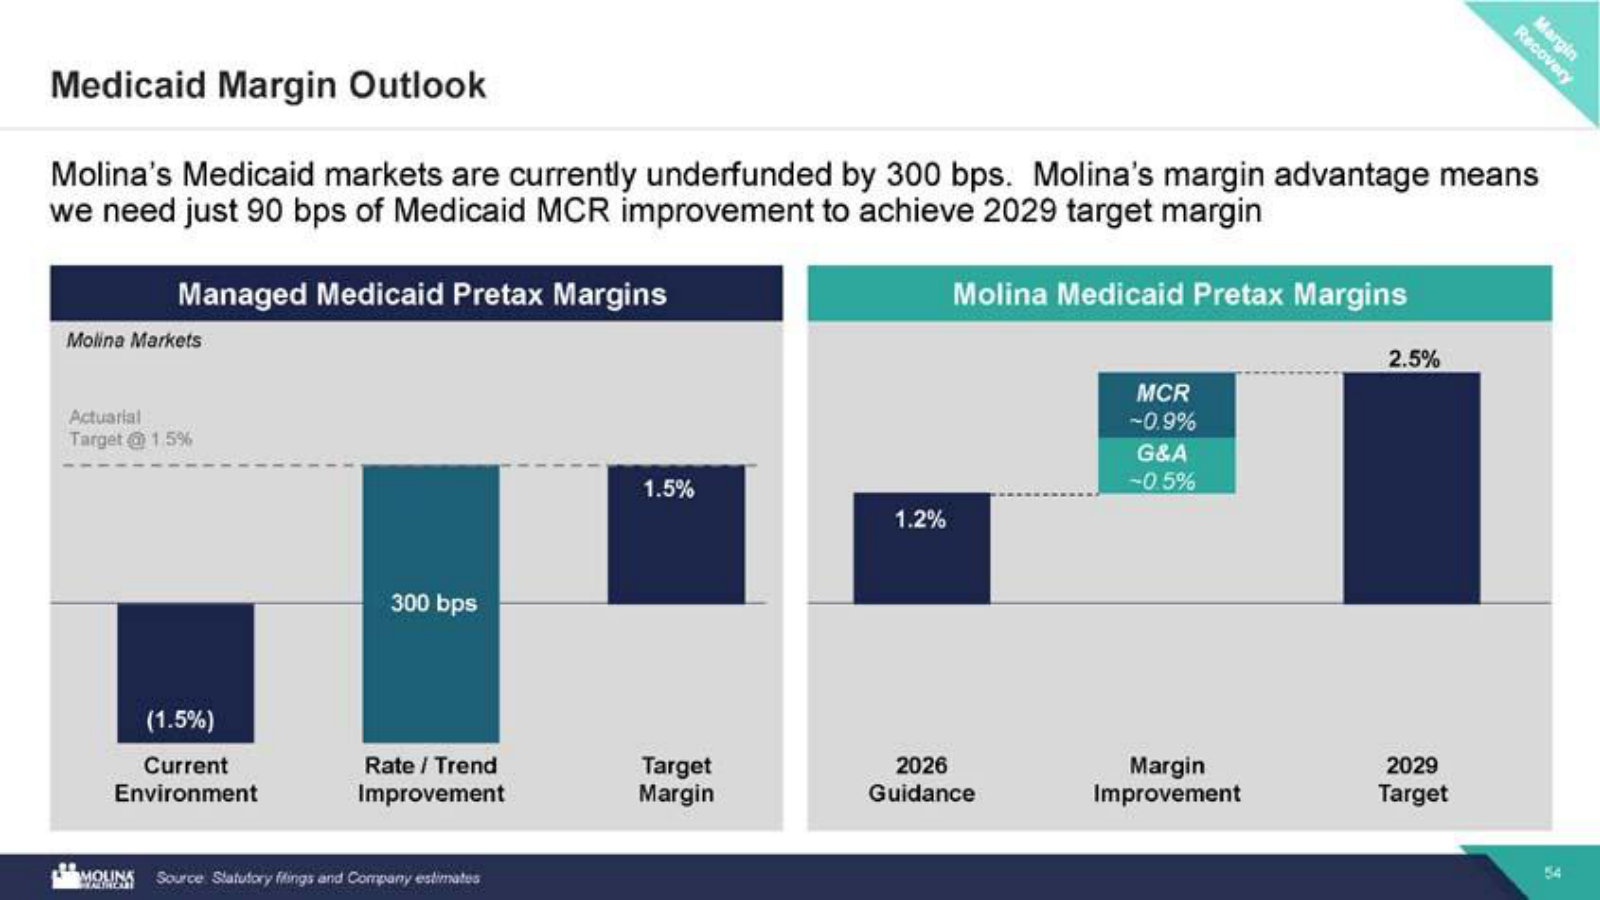
Lance Wilkes (Bernstein), analyst; Joe Zubretsky, President & CEO: Generally speaking, we're seeing states step up to the reality that a cost inflection has occurred and they are catching up to it. What do they need to catch up to? If you look at the trends we've experienced over the past three years, 4.5, 6.5 and 7.5, the cost baseline is 20% higher than it was three years ago. That's what they need to catch up to. Now we believe we're operating 300 to 400 basis points better than the average market. So as they catch up, we should be moving into much more positive territory than we already are. Bearing in mind, our guidance in Medicaid is for a 1.5% pretax margin this year, eliminating the impact of Florida Kids.
p. 11 · Read in context →
Q4 & Full-Year 2025 Earnings Call — Q4 FY2025 (Feb 2026)
The reset: full-year attribution of a halved EPS, the anatomy of the Medicaid rate/trend gap, the growth engine, and the case that 2026 is the trough. · Open the full transcript →
Attributes the halving of EPS: Marketplace, at 10% of premium, drove nearly half the miss; Medicaid a third; Medicare the rest.
Joe Zubretsky, President & CEO: As we compare our initial 2025 EPS guidance of $24.50 to our final result of $11.03, nearly half of the underperformance for the year was attributable to the unprecedented trend and increased acuity in our Marketplace segment. A very disproportionate outcome given that the segment is just 10% of our total premium. The rate and trended balance in Medicaid accounted for approximately one-third of the underperformance, while the remainder was due to persistent higher utilization in Medicare.
p. 1 · Read in context →
The miss in one line: Medicaid rates rose to 6% while trend hit 7.5%, 250 bps of it the one-time redetermination acuity shift.
Joe Zubretsky, President & CEO: Rates increased from 4.5% in our initial guidance to 6% for the year, but medical cost trend continually increased from 4.5% in initial guidance to 7.5%, an unprecedented inflection in such a short period of time. 250 basis points of this 7.5% trend is attributable to the acuity shift from membership declines related to the final stages of redeterminations. While we are disappointed in our fourth quarter and full year results, many published reports indicate our Medicaid performance is industry-leading by 300 to 400 basis points in pretax margin.
p. 1 · Read in context →
The growth engine still running in the downturn: 90%/80% RFP win rates, a $50B pipeline, and a historic $6B Florida CMS win.
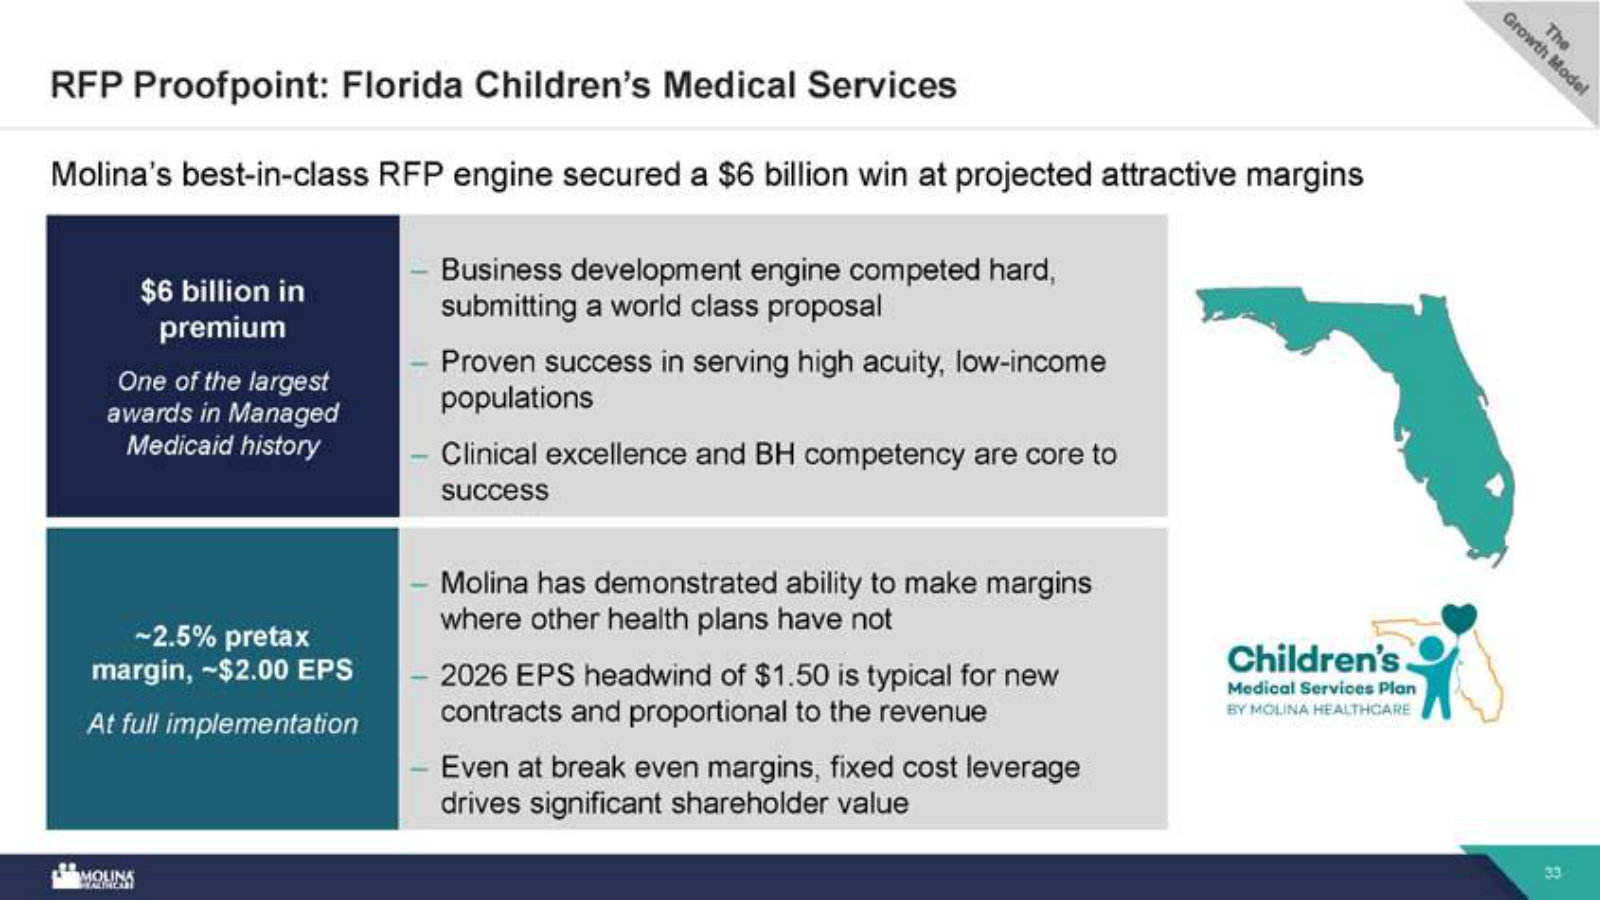
Joe Zubretsky, President & CEO: During the quarter, Molina secured a historic RFP win in Florida where the state awarded Molina the sole Children's Medical Services or CMS contract. This contract is expected to yield $6 billion in annual run rate premium and is expected to go live in late 2026. […] Since we embarked on this growth strategy, we have achieved an RFP win rate of 90% on renewal contracts, representing $14 billion in retained revenue and 80% on new contracts representing $20 billion of new revenue. We are engaged in active RFPs in several states and have an active pipeline of $50 billion of new opportunities over the next few years.
p. 1 · Read in context →
The forward thesis: 2026 is the margin trough, the market lags 300-400 bps, and each 100 bps of Medicaid MCR is worth ~$5 of EPS.
Joe Zubretsky, President & CEO: We believe our 2026 forecast for Medicaid is the trough for managed Medicaid margins. In this margin trough, we expect that Molina Medicaid will produce a low single-digit margin, not losses, and that the market is underfunded by 300 to 400 basis points. We are confident in the outlook for this business and that rates and trend will eventually reach equilibrium. […] This potential is significant as every 100 basis points on the Medicaid MCR is worth nearly $5 per share. […] Embedded earnings are now greater than $11 per share.
p. 3 · Read in context →
Challenged that a 5% 2026 trend is too low after 7.5%, he strips out the 250 bps acuity shift and details the cost categories.
Ann Hynes (Mizuho), analyst; Joe Zubretsky, President & CEO: Therefore, when I see a 5% trend projected for the future, I find that insufficient. I would appreciate more detailed information regarding specific state actions, utilization management, or anything else that could clarify why you believe the trend will only grow by 5%. […] we had a 7.5% trend in '25 off of '24. With perfect hindsight, 2.5 percentage points of that was related to the redetermination related acuity shift as we've just been describing in a couple of questions that were asked. So core trend is 5%. Core trend includes every impact. It's a supply and demand economy. It includes the higher acuity of the American population that we serve. It includes any 'upcoding' or aggressive billing from providers. 5% is what we experienced in 2025. And again, it's off a cost base that's increased 20% over the past 3 years. It's 50% higher than historical averages. Medicaid trend over the last 10, 15 years has been 2% to 3%.
p. 9 · Read in context →
Q2 FY2025 Earnings Call — Q2 FY2025 (Jul 2025)
The shock: a $5.50 guidance cut mid-year. The thesis gets tested — what is driving costs, why the corridor hedge ran out, and whether rates can ever catch up. · Open the full transcript →
Catalogs the cost drivers of the shock — behavioral, high-cost drugs, inpatient, ER — and calls their persistence unprecedented.
Joe Zubretsky, President & CEO: Behavioral health costs have increased nationally reflecting both supply side and demand side drivers and imposed limitations on utilization management in certain states. High-cost drugs remain a source of pressure driven by higher script volumes and the introduction of a variety of expensive therapies beyond GLP-1s for conditions such as cancer and HIV. Higher inpatient utilization in the quarter was driven by a higher volume of admissions for complex health episodes, many of which originated from increased ER visits. […] This is the fourth consecutive quarter we have observed some combination of these trends. The magnitude and persistence of these medical cost increases are unprecedented.
p. 1 · Read in context →
The clearest teaching on the mechanism: how rates and risk corridors buffered trend, then were exhausted quarter by quarter.
Joe Zubretsky, President & CEO: Starting in the third quarter of 2024, while an increasing trend emerged from the end of the redetermination process, rates and Molina's risk corridor positions at the time were sufficient to offset that increasing trend. By the fourth quarter of 2024, the increasing medical cost trend moved beyond the 2024 midyear rate updates, and corridors have largely become depleted. Moving into the first quarter of 2025, the January 1 rate cycle captured much of the continued trend pressure. And now in the second quarter of 2025, we experienced yet another increase in trend, which moved beyond the rate updates received in the first quarter, and risk corridor protection at this point is very limited and isolated.
p. 2 · Read in context →
The cut, and the concentration lesson: Marketplace is 10% of revenue but nearly half the 140 bps of MCR pressure behind it.
Joe Zubretsky, President & CEO: Our full year 2025 adjusted earnings per share guidance is now expected to be no less than $19 per share, a floor, if you will, which is $5.50 below our initial guidance of $24.50 […] Our full year guidance now includes 140 basis points of consolidated MCR pressure compared to our initial guidance at $24.50, which is disproportionately attributed to Marketplace. Marketplace is 10% of our revenue and accounts for nearly half of this 140 basis point MCR revision.
p. 2 · Read in context →
Why Marketplace's natural hedge failed: a market-wide 8% jump in risk-pool acuity means risk adjustment can't keep up with trend.
Josh Raskin (Nephron Research), analyst; Joe Zubretsky, President & CEO: So I guess I'm just still struggling with what do you think is the root cause of this pickup in utilization and now, I guess, market-wide? […] The acuity of the entire marketplace risk pool is higher by 8% year-over-year, which means on a relative basis, risk adjustment is not going to keep up with the elevated trend. As I said, we've increased our trend assumption from 7% that went into pricing to 11% in our forecast.
p. 7 · Read in context →
The hardest question — if rates always lag a shifting risk pool, do you ever catch up? — answered with candid uncertainty on timing.
Kevin Fischbeck (Bank of America), analyst; Joe Zubretsky, President & CEO: you'll get the rate cycle to reflect last year's cost, but this year's cost will be high. This year's cost, we'll still see risk pool shifts. So like do you ever catch up? […] Currently, we are operating at a 91% medical cost ratio, which is 190 basis points above the upper limit of our range. To reach our target margin, we need an additional 200 basis points on top of the trend. Based on external evaluations, we believe that the wider market will require even more than this. If we can secure those extra 200 basis points along with an appropriate trend, we should be able to return to our target margin. Whether this will be achieved by January 1, 2026, is still uncertain.
p. 11 · Read in context →
Q4 & Full-Year 2024 Earnings Call — Q4 FY2024 (Feb 2025)
The pre-crisis annual: the growth algorithm, how risk corridors really work, Marketplace pricing calibration, and Medicaid's political durability. · Open the full transcript →
The growth algorithm in plain terms — new state wins — and why embedded earnings near 30% of run-rate EPS underwrite future growth.
Joe Zubretsky, CEO: 2024 was an extraordinary year for securing future growth on top of the reported 19% premium revenue growth, starting with recent acquisitions. […] in Georgia, the state announced its intent to award it to Medicaid managed care services contract. This was a significant win with an estimated $2 billion in annual premium revenue based on expected market share. […] Having embedded earnings of at least 20 to 25% of run rate EPS is an attractive benchmark to support future EPS growth. Now at approximately 30%, we are very well positioned to meet our long-term targets.
p. 2 · Read in context →
The best explanation of why risk corridors are an imperfect hedge: protection is uneven across 21 states, may miss where trend hits.
Andrew Mok (Barclays), analyst; Joe Zubretsky, CEO; Mark Keim, CFO: It's a matter of geography. As we've always said, we're almost loathed to give a number of how deep we are in corridors because while it is a hedge, it's an imperfect hedge. If you have underperformance, it depends where that underperformance happens, whether you get the benefit of the corridor. In the fourth quarter this year, while we had forecasted, I believe, 50 basis points of trend pressure absorbed by the corridors, it didn't pan out that way. […] We're in 21 states. And the benefit of the corridor is not evenly distributed across 21 states. So what really matters is where does the trend pressure show up versus where is corridor protection remaining. That could either help you significantly or it can leave you no benefit, which is more or less what happened in the fourth quarter.
p. 6 · Read in context →
The political-durability thesis: whatever the funding mechanism, neither party wants more uninsured, so Medicaid change stays marginal.
A.J. Rice (UBS), analyst; Joe Zubretsky, CEO: the market really focuses on the how. You know, if you come up with a per capita cap scheme, FMA match for reduction FMAP match reduction on expansion, block match, whatever the mechanism is the CBO can score. That's not the issue. The issue is what are you going to reduce in terms of where the money goes? […] Neither side of the aisle wants to see more uninsured. It's below ten percent of eligibles for the first time in decades. Reduction in benefits. Reduction in enrollment, reduction in payments to providers, or none of the above. And I either have to, as a state, decrease my education budget or raise taxes. None of those solutions is politically tenable. That's why we conclude that any changes to manage Medicaid as we know it today would be marginal.
p. 11 · Read in context →
How Marketplace pricing is calibrated: reinvest excess margin into growth or hit the three-year minimum-MLR rebate.
Scott Fidel (Stephens), analyst; Joe Zubretsky, CEO: we consciously when you're producing ten percent to eleven percent pretax margins two years in a row, one, you gotta remain competitive. And two, if you keep it there, you're gonna run into the three-year minimum MLR. So it makes perfect sense to invest the excess margin and growth. It's a calibration. You try to set your product to be competitively positioned. As I said, we are number one or two silver priced in fifty percent of our geographies. We netted a hundred and thirty thousand members in open enrollment. Had, I think, two hundred fifty thousand ads and a hundred and thirty terms, which gave us a nice jumping-off point. So we have high confidence in the mid-single-digit margin.
p. 14 · Read in context →
More calls
Q3 FY2025 Earnings Call — Q3 FY2025 (Oct 2025) · 13 pages · The second cut of the year ($19 to $14). Go here for the Marketplace swing from +$3 to -$2 of EPS and how H2 Medicaid was annualized into the 2026 baseline. · Open →
Q1 FY2025 Earnings Call — Q1 FY2025 (Apr 2025) · 12 pages · The calm before the storm: guidance still $24.50. The clearest statement of the actuarial-soundness thesis and Molina running 200-300 bps better than the market. · Open →
Q3 FY2024 Earnings Call — Q3 FY2024 (Oct 2024) · 14 pages · Mid-unwinding: management calls Q3 the 'widest point' between rates and trend, details the corridor burn-down, and points to a 9% Q4 rate update as proof states respond. · Open →
Q2 FY2024 Earnings Call — Q2 FY2024 (Jul 2024) · 13 pages · Where the corridor-as-buffer thesis was first stress-tested — the '200 basis points deep' concept defined, and Fischbeck pressing on why Molina saw less pressure than peers. · Open →
Q4 & Full-Year 2023 Earnings Call — Q4 FY2023 (Feb 2024) · 13 pages · The foundational annual: the plainest statement of the capitated-risk model, the growth track record ($12B reprocured, $7B new since 2019), and Bright acquisition accounting. · Open →
Q3 FY2023 Earnings Call — Q3 FY2023 (Oct 2023) · 12 pages · Redetermination mechanics as they unfolded: procedural vs. verification disenrollments, ~30% reconnect rate, and the Medicare cost drivers that led to 2024 benefit-design cuts. · Open →
Q2 FY2023 Earnings Call — Q2 FY2023 (Jul 2023) · 15 pages · The launch of Medicaid redeterminations explained from the ground up — ex parte renewals, retroactive reconnection, and the bottoms-up 2024 revenue bridge. · Open →
Molina Healthcare, Inc.'s annual reports contain management's most considered account of the business. These are the sections, passages and visual pages worth opening in the originals preserved in Sources.
Molina Healthcare, Inc. — FY2025 Annual Report (Form 10-K) — FY2025
The year the thesis was tested: net income fell to $472M from $1,179M as the medical care ratio jumped to 91.7%; OBBBA reshapes the runway. · Open the full document →
Item 1. Business — Overview — p. 7 · Read the full section →
Defines a pure-play government-sponsored insurer: ~5.5M members across 21 states, paid fixed premiums under four segments.
Item 1. Business — Trends and Uncertainties: OBBBA — p. 23 · Read the full section →
Management's own read on the legislative shocks that shrink the runway — Medicaid work rules and expiring Marketplace subsidies.
OBBBA's expected 15–20% cut to 1.2M Expansion members and phased Marketplace eligibility curbs.
The President signed the OBBBA into law in July 2025, which contains changes to the Medicaid and Marketplace programs. […] We currently estimate the reduction in enrollment will be in the range of 15% to 20% by 2029 on 1.2 million members in our Medicaid Expansion population, and any acuity shifts should be modest and gradual. […] The law limits which legal aliens may be eligible for Marketplace PTCs and will require pre-enrollment eligibility verification for enrollees to receive PTCs. These changes are planned to be phased in over the period from 2026 to 2028 and are expected to reduce national Marketplace enrollment as well.
p. 23 · Read in context →
Item 1A. Risk Factors — p. 39 · Read the full section →
The two risks that actually bite a thin-margin capitated insurer: state rates lagging cost trend, and a volatile Marketplace.
Fixed premiums vs rising costs — the core margin risk, already showing up in prior quarters.
Our premium revenues consist of fixed monthly payments per member, and supplemental payments for other services such as maternity deliveries. These premiums are fixed by contract, and we are obligated during the contract periods to provide healthcare services as established by the state governments in which our health plans operate. […] If the premiums paid to us are not increased at a rate that is commensurate with the rate at which medical expenses related to healthcare services rise, or the rate at which health care utilization rates increase, our medical margins will be compressed or eliminated, and our earnings will be negatively affected. We have seen in prior quarters that medical expenses have risen higher than anticipated, and that our capitation rates have not kept pace with the sharp rate of that medical care cost increase.
p. 39 · Read in context →
Margin fragility quantified: one point of MCR would have cut diluted EPS from $8.92 to ~$2.72.
Because the premium payments we receive are generally fixed in advance and we operate with a narrow profit margin, relatively small changes in our medical care ratio can create significant changes in our overall financial results. For example, if our overall medical care ratio of 91.7% for the year ended December 31, 2025, had been one percentage point higher, or 92.7%, our net income per diluted share for the yea ended December 31, 2025 would have been approximately $2.72 rather than our actual net income per diluted share of $8.92, a difference of $6.20.
p. 41 · Read in context →
Item 7. MD&A — Consolidated Results — p. 77 · Read the full section →
Management explains why 2025 earnings halved: MCR rose across every segment while rates lagged.
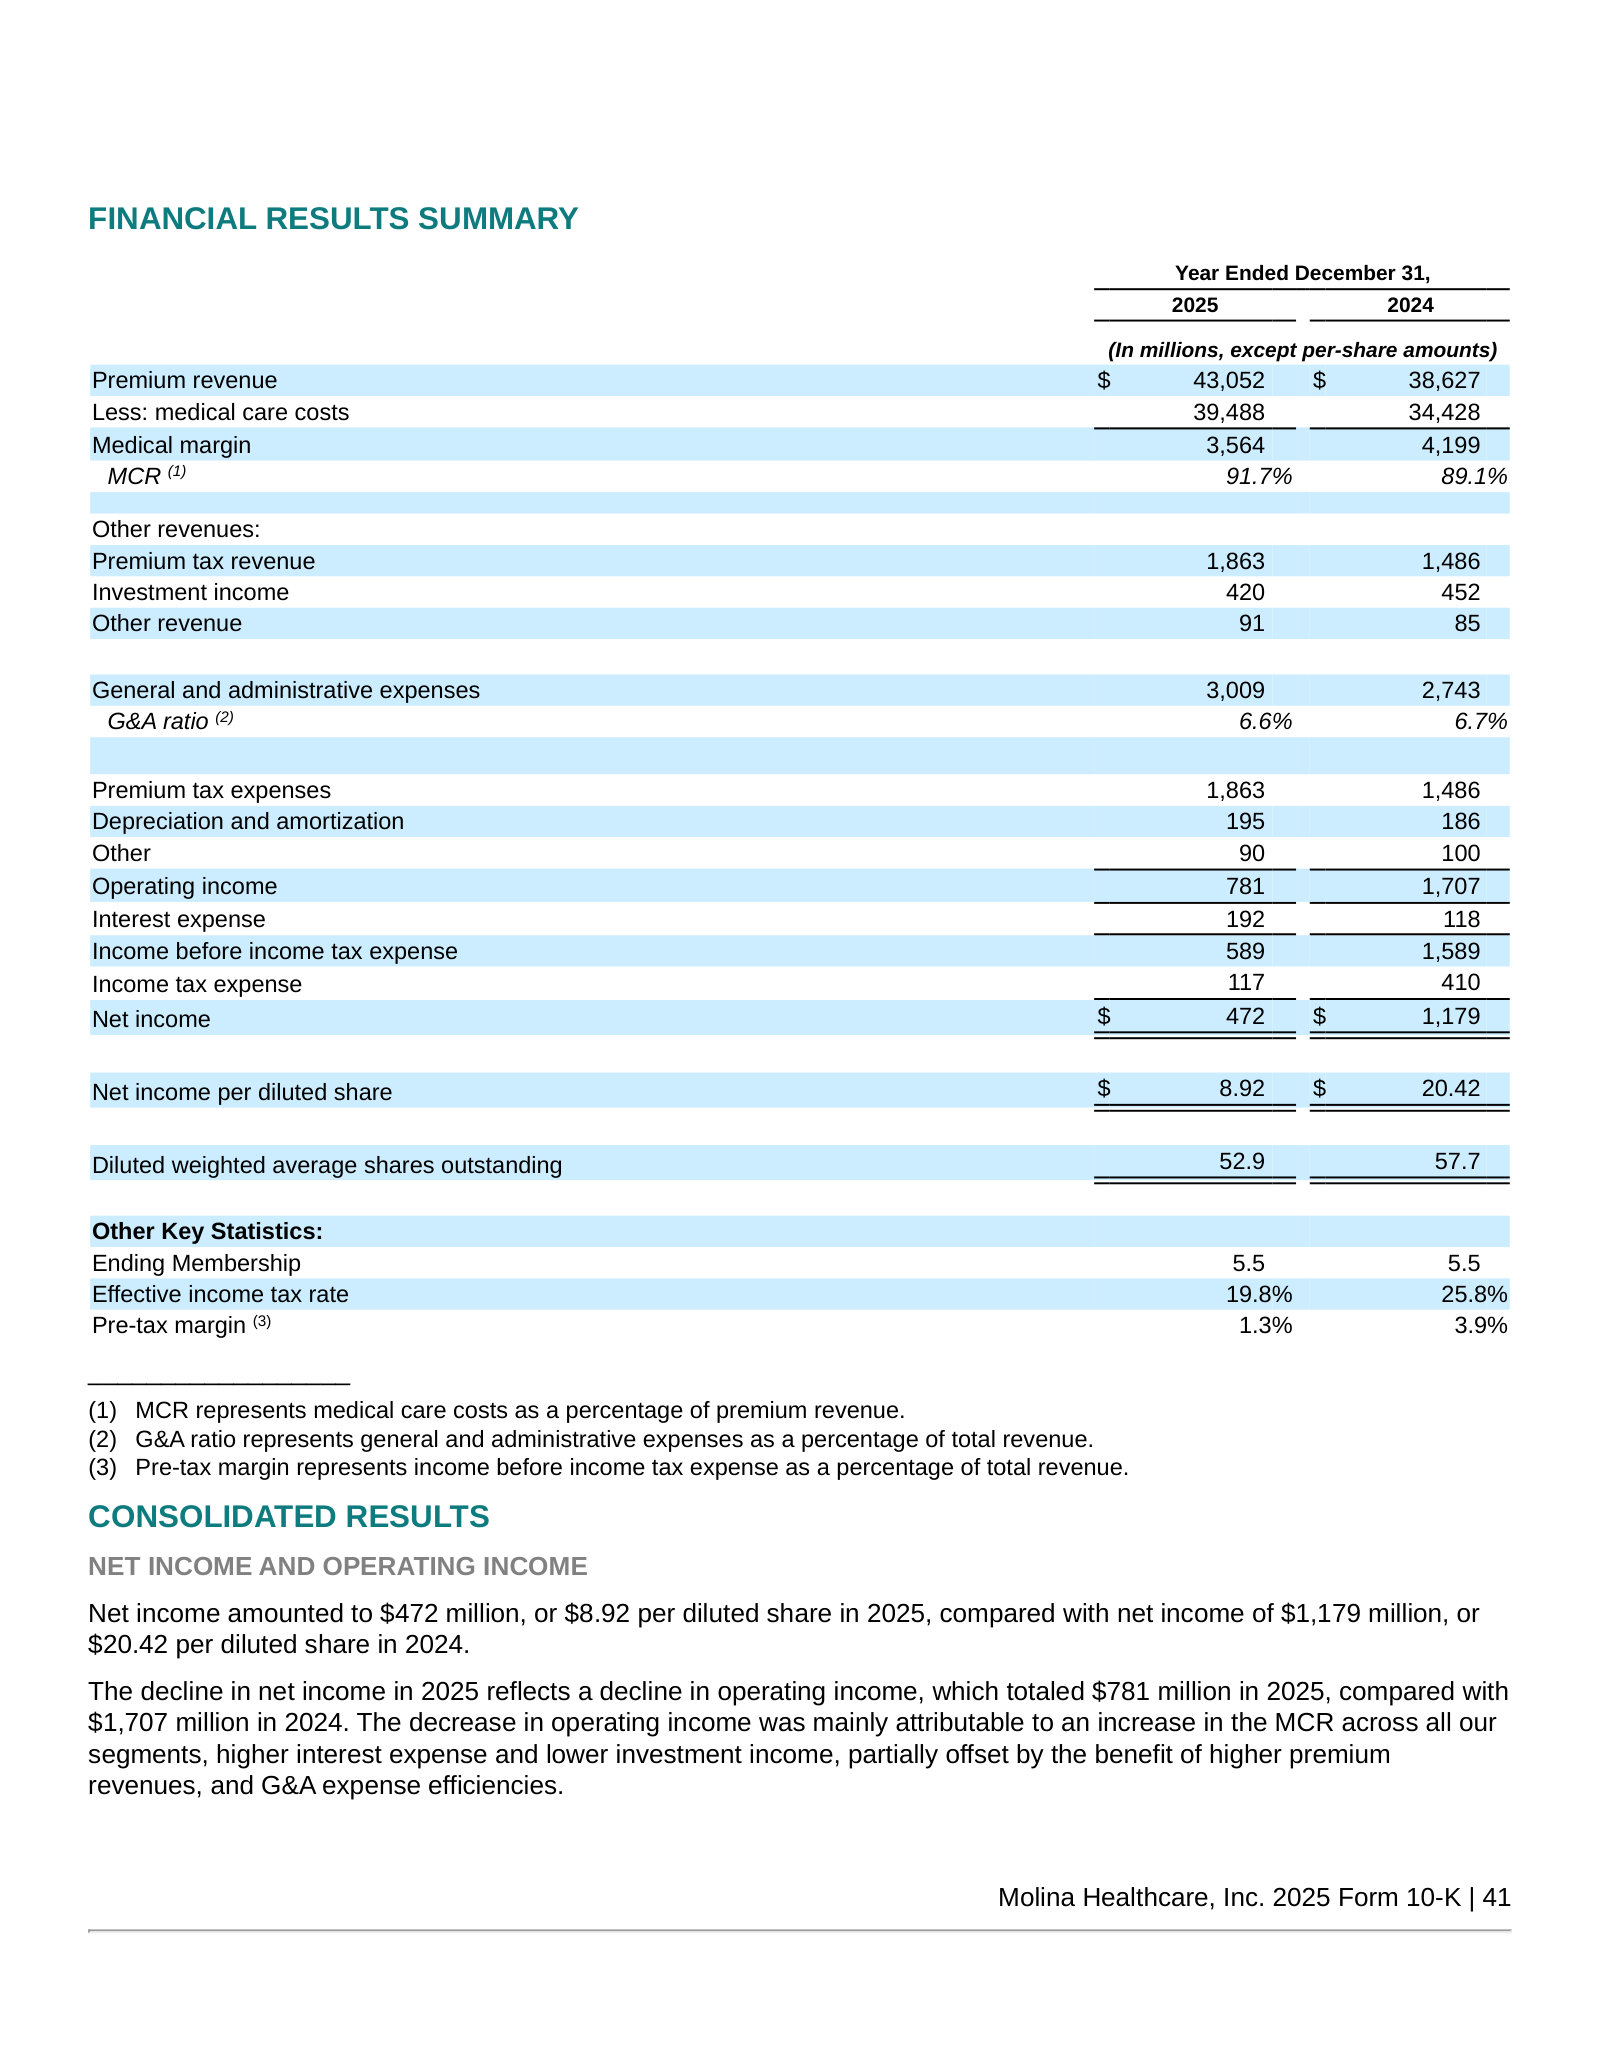
The earnings decline attributed to higher MCR across all segments and interest expense.
The decline in net income in 2025 reflects a decline in operating income, which totaled $781 million in 2025, compared with $1,707 million in 2024. The decrease in operating income was mainly attributable to an increase in the MCR across all our segments, higher interest expense and lower investment income, partially offset by the benefit of higher premium revenues, and G&A expense efficiencies.
p. 78 · Read in context →
Item 7. MD&A — Segment Financial Performance — p. 81 · Read the full section →
Where the margin broke, segment by segment — Medicaid MCR to 91.8% and Marketplace normalizing off a 75.4% base.
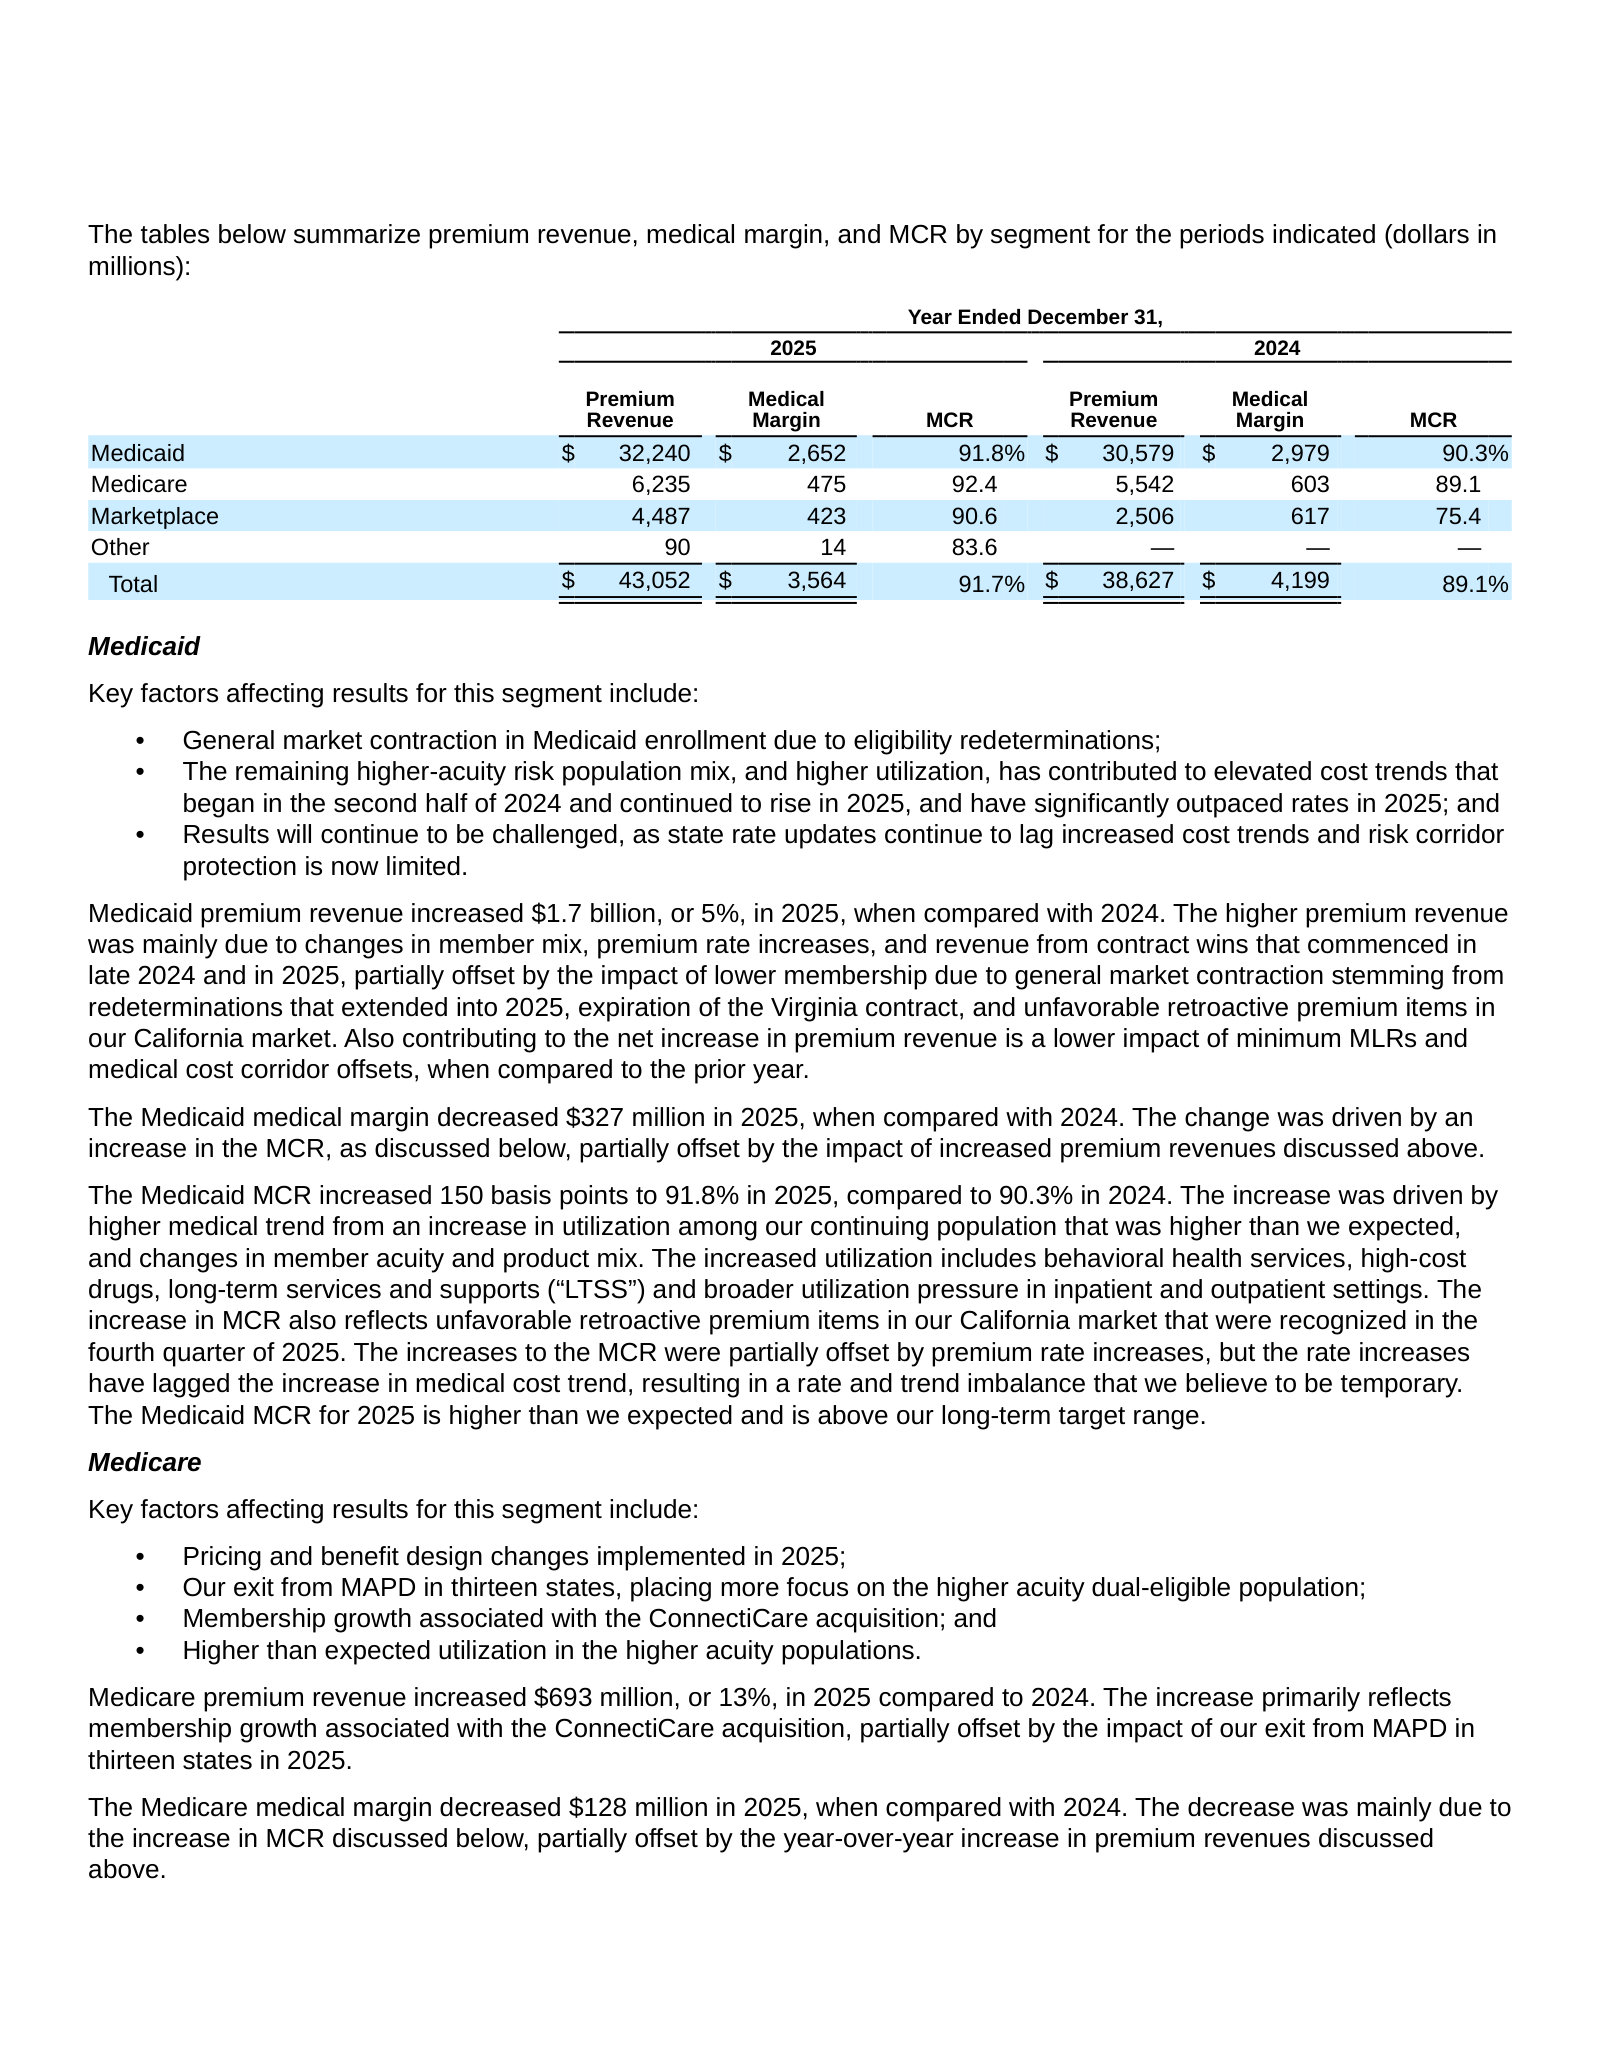
Medicaid MCR up 150bps on utilization; rates lagging trend in a 'temporary' imbalance.
The Medicaid MCR increased 150 basis points to 91.8% in 2025, compared to 90.3% in 2024. The increase was driven by higher medical trend from an increase in utilization among our continuing population that was higher than we expected, and changes in member acuity and product mix. […] The increases to the MCR were partially offset by premium rate increases, but the rate increases have lagged the increase in medical cost trend, resulting in a rate and trend imbalance that we believe to be temporary.
p. 82 · Read in context →
Item 7. MD&A — Critical Accounting Estimates: Medical Claims and Benefits Payable — p. 94 · Read the full section →
The one estimate that defines a capitated insurer's earnings — IBNP reserves built on completion factors and cost-trend assumptions.
Why IBNP is the critical judgment: completion factors and healthcare cost trend drive the reserve.
The estimation of the IBNP liability requires considerable judgment in applying actuarial methods, determining the appropriate assumptions, and considering numerous factors. Of those factors, we consider estimated completion factors (measures the cumulative percentage of claims expense that will ultimately be paid for a given month of service based on historical payment patterns) and the assumed healthcare cost trend (percent change in per-member per-month incurred medical care costs) to be the most critical assumptions.
p. 94 · Read in context →
More annual reports
Molina Healthcare, Inc. — FY2024 Annual Report (Form 10-K) — FY2024 · 155 pages · The peak-margin baseline (MCR 89.1%, EPS $20.42) against which the FY2025 compression reads. · Open →
Molina Healthcare, Inc. — FY2023 Annual Report (Form 10-K) — FY2023 · 151 pages · Captures the Medicaid redetermination unwind as pandemic continuous-enrollment protections lapsed. · Open →
Molina Healthcare, Inc. — FY2022 Annual Report (Form 10-K) — FY2022 · 142 pages · Peak-enrollment year still boosted by pandemic-era continuous Medicaid coverage. · Open →
Molina Healthcare, Inc. — FY2021 Annual Report (Form 10-K) — FY2021 · 142 pages · The acquisition-fueled growth phase (Magellan Complete Care, Affinity) that built the current footprint. · Open →
Competitors describe Molina Healthcare, Inc.'s market in their own filings and calls. These verified passages and visual pages show where their strategies meet, using source documents preserved in Sources.
Centene Corporation (CNC)
Centene is Molina's closest pure-play peer — the largest Medicaid and ACA Marketplace insurer in the country, competing directly for the same state contracts, exchange members and dual-eligible populations.
Centene's 10-K claims the number-one position in Medicaid and Marketplace and one of the highest D-SNP concentrations among peers — the three government programs that make up Molina's entire book.
we are the nation's largest Medicaid and Marketplace insurer, as well as the largest stand-alone PDP provider. Our Medicare Advantage business includes one of the highest concentrations of D-SNP members among our peers, aligned with our focus on low-income, complex populations.
p. 12 · Read in context →
Centene sizes the Medicaid market (CMS: 7% annual growth to $1.5 trillion by 2031) and states its own Medicaid scale — 12.5 million members across 30 states.
CMS estimates Medicaid spending will grow at an average annual rate of 7% to $1.5 trillion by 2031. […] We are the largest Medicaid health insurer in the country, serving 12.5 million Medicaid members in 30 states as of December 31, 2025.
p. 14 · Read in context →
Centene's stated Marketplace scale — 5.5 million ACA exchange members in 29 states under its Ambetter brand — the same subsidized-individual market where Molina competes.
We are the largest Marketplace carrier, serving 5.5 million members across 29 states as of December 31, 2025, under the brand name Ambetter Health.
p. 18 · Read in context →
Elevance Health, Inc. (ELV)
Elevance is one of the largest Medicaid managed-care operators and a major ACA carrier; its earnings calls detail the Medicaid rate/acuity squeeze and Medicaid-to-exchange migration that also drive Molina's results.
Elevance's CFO says state Medicaid rates continue to lag member acuity, pushing its 2025 Medicaid margin modestly negative with a further decline of at least 125 bps expected in 2026 — the rate-adequacy squeeze common to Medicaid MCOs.
Mark Kaye (CFO): Medicaid performance reflected pressure from elevated acuity and utilization, which were not fully offset by rate updates. We now expect our full year 2025 Medicaid operating margin to be modestly negative, establishing a baseline from which we anticipate a decline of at least 125 basis points in 2026 as rates continue to lag acuity and utilization trends remain elevated.
p. 2 · Read in context →
Elevance's CFO attributes roughly 70% of its rising ACA medical-cost trend to higher-acuity members moving from Medicaid into the exchanges during redeterminations — a market-migration dynamic that runs across Molina's Medicaid and Marketplace lines.
Mark Bradley Kaye (CFO): There are three main factors we are observing that contribute to the significant increase in medical trends in our ACA business. First, the risk pool's acuity and morbidity have significantly increased due to a higher ratio of healthier members, particularly in states with a larger number of fully subsidized individuals. This change has been driven by market exits and the movement of higher acuity members from Medicaid to ACA during the redetermination process, which accounts for approximately 70% of the total impact.
p. 3 · Read in context →
Elevance ties its 2026 Medicaid membership outlook to redetermination normalization, state program changes and RFP outcomes — naming competitive state contract results as a swing factor in the shared Medicaid market.
Mark Kaye (CFO): our Medicaid membership outlook, while very preliminary at this point, does consider things like the continued normalization following the redetermination process as well as the impact of state program changes and RFP outcomes. Whilst we do expect some churn to persist into next year, we do expect the pace of disenrollment to be manageable, and we are beginning to see stabilization in some of our markets.
p. 10 · Read in context →
UnitedHealth Group Incorporated (UNH)
UnitedHealth's Community & State unit is among the largest Medicaid managed-care businesses; through it and its D-SNP/duals franchise, UNH bids against Molina for state Medicaid contracts.
UnitedHealth sizes its Medicaid franchise (UnitedHealthcare Community & State) at more than 7.4 million people across 33 states and DC, including 1.2 million in ACA Medicaid expansion — the scale a state-focused rival like Molina competes against.
UnitedHealthcare Community & State’s primary customers oversee Medicaid plans, including Temporary Assistance to Needy Families; Children’s Health Insurance Programs (CHIP); Dual SNPs (DSNPs); Long-Term Services and Supports (LTSS); Aged, Blind and Disabled; and other federal, state and community health care programs. As of December 31, 2024, UnitedHealthcare Community & State participated in programs in 33 states and the District of Columbia, and served more than 7.4 million people; including 1.2 million people through Medicaid expansion programs in 20 states under the Patient Protection and Affordable Care Act (ACA).
p. 12 · Read in context →
UnitedHealth's UnitedHealthcare president cites state-rate pressure, expected Medicaid membership attrition and negative 2026 margins pending state rate alignment — the same Medicaid funding backdrop Molina navigates.
Timothy Noel (President, UnitedHealthcare): Community & State results continue to reflect pressures in state-based rate environments, but were within the overall expected range. […] In Medicaid, we remain focused on improvements in high acuity care management and operating cost management. […] We continue to expect membership attrition and negative margins in 2026 in light of continuing high trend and insufficient funding with modest margin improvements beginning in 2027. […] Appropriately aligning state rates to elevated medical cost trends in these programs is essential to sustainably serving people who rely on them.
p. 2 · Read in context →
CVS Health Corporation (CVS)
Through Aetna, CVS competes in Medicaid, Medicare Advantage, D-SNP and duals — though it exited the ACA exchanges in 2026, marking a strategic divergence from Molina's exchange growth.
CVS's CFO frames the individual-exchange exit as a 2026 tailwind and takes a 'cautious outlook' on Medicaid amid industry-wide pressure — Aetna prioritizing margin over the exchange and Medicaid growth Molina pursues.
Brian Newman (Chief Financial Officer): This includes another year of progress in our Medicare Advantage business, supported by our disciplined approach to plan design and footprint in individual as well as repricing opportunities in our group business. We also expect a tailwind from our exit of the individual exchange business. Although our conversations with our Medicaid state partners continue to progress and this business has performed in line with our expectations this year, we are taking a cautious outlook in light of the broader pressures across the industry.
p. 5 · Read in context →
Humana Inc. (HUM)
Humana is Medicare-centric but is expanding its Medicaid footprint (now 13 states, adding Georgia and Texas) and is a large dual-eligible/D-SNP player, overlapping Molina in duals and state Medicaid.
Humana lists its Medicaid state-contract footprint (10 states) and its dual-eligible integration strategy across Medicaid, Medicare Advantage and PDP — the duals and Medicaid ground where the Medicare-centric insurer overlaps Molina.
We have contracts in multiple states to serve Medicaid-eligible members, including Florida, Kentucky, Illinois, Indiana, Louisiana, Ohio, Oklahoma, South Carolina, Virginia and Wisconsin. We also serve members who qualify for both Medicaid and Medicare, referred to as "dual eligible", through our Medicaid, Medicare Advantage, and stand-alone prescription drug plans. As the dual eligible population represents a disproportionate share of costs, Humana is participating in varied integration models designed to improve health outcomes and reduce avoidable costs.
p. 10 · Read in context →
Humana's CEO says its Medicaid footprint now spans 13 states, with Georgia and Texas launching next year — a direct expansion into large Medicaid markets where Molina operates.
James Rechtin (President and CEO): we continue to grow our Medicaid and CenterWell footprint. Medicaid now spans 13 states. Including Georgia and Texas, which are anticipated to launch next year. We also hope to soon announce a strategic acquisition in the primary care space.
p. 2 · Read in context →
Humana's Medicaid (state-based) membership grew 10.7% to about 1.6 million as of year-end 2025, driven mainly by its newly implemented Virginia contract — evidence of a peer adding Medicaid share through state wins.
State-based contracts and other membership increased 155,700 members, or 10.7%, from 1,459,900 members as of December 31, 2024 to 1,615,600 members as of December 31, 2025 primarily due to the Virginia contract implemented in 2025 […]
p. 50 · Read in context →
The Cigna Group (CI)
Cigna is the most distant peer: it has no Medicaid or Medicare risk business and has deliberately shrunk its ACA exchange book, so it collides with Molina only at the individual-exchange edge.
Cigna's president states it has 'no exposure to Medicaid or Medicare,' serving those customers only through its Evernorth (PBM/services) portfolio — the clearest marker of how little Cigna's risk-bearing book overlaps Molina's.
Brian C. Evanko (President and COO): we have intentionally positioned our Cigna Healthcare portfolio with a product mix that has proven favorable in the current environment as we have no exposure to Medicaid or Medicare, instead choosing to serve these customers through our Evernorth services portfolio.
p. 3 · Read in context →
Cigna's president recounts shrinking its individual-exchange book from ~1 million to under 400,000 members to prioritize margin, noting competitors grew and industry exchange enrollment rose nearly 50% — sizing the ACA market Molina and Centene expanded into.
Brian C. Evanko (President and COO): At that point in time, we served nearly 1 million customers in the individual exchanges, albeit with mixed financial performance. Based upon our performance as well as our forward view of the market, we made the strategic choice to prioritize margin over growth, which included adjustments to product and network strategies, refinements to our geographic footprint, and increased prices where necessary. […] we now serve fewer than 400,000 customers in this business, down materially from the nearly 1 million we served in 2023. […] some of our competitors showed meaningful growth in their individual exchange businesses, while we chose to reposition our portfolio, which resulted in fewer individual exchange customers for Cigna Healthcare. […] Meanwhile, across the industry, individual exchange enrollment is up nearly 50% over that same time period.
p. 8 · Read in context →
More peer documents
Centene — Q1 FY2026 earnings call — Q1 FY2026 · 13 pages · Centene's CFO adds $1B of premium revenue 'largely driven by Texas Medicaid' and guides Marketplace membership down to ~3.5M after the enhanced-APTC expiration — a live read on the Medicaid RFP and exchange markets Molina shares. · Open →
Centene — Q4 FY2025 earnings call — Q4 FY2025 · 14 pages · Details the 2026 Marketplace revenue cliff (~-$8B) from APTC expiration and Medicaid member-months down 5-6% — quantifying the enrollment shock across both of Molina's largest lines. · Open →
Humana — FY2024 annual report (10-K) — FY2024 · 157 pages · Prior-year Medicaid state-contract list (9 states) and D-SNP membership of 937,100 — the baseline against which Humana's 2025 Medicaid/duals expansion is measured. · Open →
CVS Health — FY2024 annual report (10-K) — FY2024 · 340 pages · Enumerates Aetna's Public Exchange, Medicare Advantage, Medicaid, dual-eligible and D-SNP product regulation — a full map of where CVS/Aetna overlaps Molina before the 2026 exchange exit. · Open →
The Cigna Group — FY2024 annual report (10-K) — FY2024 · 214 pages · Describes Cigna's small ACA Individual & Family Plans (11 states) and notes Medicaid-redetermination members seeking marketplace coverage — the thin edge where Cigna touches Molina's world. · Open →
UnitedHealth Group — Q4 FY2025 earnings call — Q4 FY2025 · 13 pages · CFO Wayne DeVeydt quantifies 2026 Medicaid rate increases of 6-7% 'below our expectations' with expected margin and membership contraction — UNH's own read on Medicaid rate adequacy. · Open →
Source: S&P Capital IQ consensus via Xpressfeed · Generated 2026-07-17.
Street snapshot
The 17 price targets span a wide $129 to $286, with a $210.76 mean sitting just above the $209 median.
Currency: USD · Scale: money in millions, absolute (per share) · Analyst counts shown explicitly; recommendation respondents: 19.
| Street view | Reading | Analysts |
|---|---|---|
| Recommendation mix | Buy 3, Outperform 0, Hold 15, Underperform 1, Sell 0 | 19 |
| Consensus score | 2.74 | 19 |
| Target price | mean 210.8; high 286.0; low 129.0 | 17 |
Forward table
The larger move is in earnings, where normalized EPS is modeled to more than halve to roughly $5.16 in FY2026 and then rebuild to $9.29 in FY2027, with no dividend forecast across the window.
Currency: USD · Scale: money in millions, absolute (per share) · Analyst count is the estimate count for each period and metric.
| Period | Metric | Mean | YoY | Analysts | Low / high |
|---|---|---|---|---|---|
| FY0E | Revenue | 44,277 | -2.5% | 15 | 42,247 / 45,764 |
| FY0E | EBITDA | 682.8 | -33.8% | 9 | 552.4 / 749.0 |
| FY0E | EBIT | 535.0 | -50.8% | — | — / — |
| FY0E | Net income (GAAP) | 153.8 | -67.4% | 9 | 72.07 / 238.5 |
| FY0E | Net income (normalized) | 262.5 | -64.5% | — | — / — |
| FY0E | EPS (GAAP) | 3.32 | -62.7% | 7 | 1.41 / 4.66 |
| FY0E | EPS (normalized) | 5.16 | -53.2% | 19 | 4.36 / 5.60 |
| FY0E | Free cash flow | 1,861 | -433.5% | — | — / — |
| FY0E | Dividend per share | 0.00 | — | — | — / — |
| FY0E | Gross margin | 12.4% | -4.9% | — | — / — |
| FY0E | Capital expenditure | -129.7 | -4.6% | — | — / — |
| FY0E | Net debt | -1,315 | 56.6% | — | — / — |
| FY0E | ROE | 6.0% | -63.4% | — | — / — |
| FY0E | Cash from operations | 1,046 | -529.5% | — | — / — |
| FY+1E | Revenue | 47,524 | 7.3% | 14 | 44,242 / 50,874 |
| FY+1E | EBITDA | 964.2 | 41.2% | 9 | 762.1 / 1,179 |
| FY+1E | EBIT | 848.6 | 58.6% | — | — / — |
| FY+1E | Net income (GAAP) | 488.2 | 217.4% | 8 | 319.9 / 695.7 |
| FY+1E | Net income (normalized) | 478.6 | 82.3% | — | — / — |
| FY+1E | EPS (GAAP) | 8.34 | 150.9% | 8 | 1.46 / 12.62 |
| FY+1E | EPS (normalized) | 9.29 | 80.1% | 19 | 3.50 / 13.50 |
| FY+1E | Free cash flow | 769.6 | -58.6% | — | — / — |
| FY+1E | Dividend per share | 0.00 | — | — | — / — |
| FY+1E | Gross margin | 12.6% | 2.3% | — | — / — |
| FY+1E | Capital expenditure | -151.5 | 16.8% | — | — / — |
| FY+1E | Net debt | -1,854 | 41.0% | — | — / — |
| FY+1E | Cash from operations | 707.6 | -32.3% | — | — / — |
| FY+1E | ROE | 10.0% | 65.3% | — | — / — |
| FY+2E | Revenue | 50,434 | 6.1% | 10 | 46,498 / 55,410 |
| FY+2E | EBITDA | 1,107 | 14.8% | 7 | 869.4 / 1,274 |
| FY+2E | EBIT | 1,077 | 26.9% | — | — / — |
| FY+2E | Net income (GAAP) | 572.1 | 17.2% | 6 | 400.4 / 803.0 |
| FY+2E | Net income (normalized) | 650.7 | 36.0% | — | — / — |
| FY+2E | EPS (GAAP) | 11.46 | 37.4% | 5 | 7.85 / 15.74 |
| FY+2E | EPS (normalized) | 12.93 | 39.1% | 13 | 9.65 / 16.70 |
| FY+2E | Free cash flow | 1,145 | 48.8% | — | — / — |
| FY+2E | Dividend per share | 0.00 | — | — | — / — |
| FY+2E | Gross margin | 12.9% | 1.8% | — | — / — |
| FY+2E | Capital expenditure | -165.4 | 9.1% | — | — / — |
| FY+2E | Net debt | -2,531 | 36.5% | — | — / — |
| FY+2E | Cash from operations | 911.7 | 28.8% | — | — / — |
| FY+2E | ROE | 10.8% | 8.7% | — | — / — |
| Q2 FY2026 | Revenue | 10,781 | -5.7% | 13 | 10,218 / 11,056 |
| Q2 FY2026 | EBITDA | 174.0 | -61.3% | 7 | 158.2 / 197.9 |
| Q2 FY2026 | EBIT | 144.2 | -67.2% | — | — / — |
| Q2 FY2026 | Net income (GAAP) | 60.23 | -76.4% | 8 | 44.00 / 89.20 |
| Q2 FY2026 | Net income (normalized) | 74.74 | -74.6% | — | — / — |
| Q2 FY2026 | EPS (GAAP) | 1.25 | -73.6% | 6 | 0.87 / 1.75 |
| Q2 FY2026 | EPS (normalized) | 1.40 | -74.4% | 18 | 0.98 / 2.04 |
| Q2 FY2026 | Free cash flow | -82.00 | -130.6% | — | — / — |
| Q2 FY2026 | Dividend per share | 0.00 | — | — | — / — |
| Q2 FY2026 | Gross margin | 12.2% | -17.1% | — | — / — |
| Q2 FY2026 | Capital expenditure | -33.45 | 3.2% | — | — / — |
| Q2 FY2026 | Net debt | -1,803 | 26.5% | — | — / — |
| Q2 FY2026 | ROE | 7.5% | -70.9% | — | — / — |
| Q2 FY2026 | Cash from operations | -312.1 | -226.9% | — | — / — |
| Q3 FY2026 | Revenue | 10,901 | -5.0% | 13 | 10,207 / 11,271 |
| Q3 FY2026 | EBITDA | 174.2 | -5.8% | 7 | 136.3 / 221.5 |
| Q3 FY2026 | EBIT | 141.5 | -54.6% | — | — / — |
| Q3 FY2026 | Net income (GAAP) | 51.25 | -35.1% | 8 | 30.05 / 81.51 |
| Q3 FY2026 | Net income (normalized) | 58.46 | -71.9% | — | — / — |
| Q3 FY2026 | EPS (GAAP) | 1.05 | -30.3% | 6 | 0.59 / 1.59 |
| Q3 FY2026 | EPS (normalized) | 1.27 | -31.1% | 18 | 0.73 / 1.92 |
| Q3 FY2026 | Free cash flow | 123.0 | -25.0% | — | — / — |
| Q3 FY2026 | Dividend per share | 0.00 | — | — | — / — |
| Q3 FY2026 | Gross margin | 12.3% | -11.4% | — | — / — |
| Q3 FY2026 | Capital expenditure | -33.92 | 3.1% | — | — / — |
| Q3 FY2026 | Net debt | -1,876 | 48.6% | — | — / — |
| Q3 FY2026 | ROE | 8.7% | -48.4% | — | — / — |
| Q3 FY2026 | Cash from operations | 194.4 | 56.7% | — | — / — |
| Q4 FY2026 | Revenue | 11,843 | 4.1% | 13 | 11,064 / 12,640 |
| Q4 FY2026 | EBITDA | 107.6 | -198.7% | 6 | 55.38 / 139.0 |
| Q4 FY2026 | EBIT | 65.39 | -1.9% | — | — / — |
| Q4 FY2026 | Net income (GAAP) | -7.93 | -95.0% | 8 | -73.51 / 22.54 |
| Q4 FY2026 | Net income (normalized) | 6.39 | -41.5% | — | — / — |
| Q4 FY2026 | EPS (GAAP) | -0.14 | -95.4% | 6 | -1.44 / 0.42 |
| Q4 FY2026 | EPS (normalized) | 0.13 | -104.7% | 18 | -1.15 / 0.85 |
| Q4 FY2026 | Free cash flow | 409.0 | — | — | — / — |
| Q4 FY2026 | Dividend per share | 0.00 | — | — | — / — |
| Q4 FY2026 | Gross margin | 11.4% | 6.9% | — | — / — |
| Q4 FY2026 | Capital expenditure | -36.17 | 11.5% | — | — / — |
| Q4 FY2026 | Net debt | -2,122 | 306.4% | — | — / — |
| Q4 FY2026 | Cash from operations | 174.6 | -893.5% | — | — / — |
| Q4 FY2026 | ROE | -1.1% | -169.2% | — | — / — |
| Q1 FY2027 | Revenue | 11,389 | 5.5% | 6 | 10,612 / 12,229 |
| Q1 FY2027 | EBITDA | 290.6 | 77.2% | 5 | 235.3 / 396.4 |
| Q1 FY2027 | EBIT | 271.6 | 53.9% | — | — / — |
| Q1 FY2027 | Net income (GAAP) | 158.3 | 1030.5% | 5 | 113.6 / 232.4 |
| Q1 FY2027 | Net income (normalized) | 177.2 | 78.7% | — | — / — |
| Q1 FY2027 | EPS (GAAP) | 3.04 | 1027.0% | 4 | 2.23 / 4.58 |
| Q1 FY2027 | EPS (normalized) | 2.96 | 26.0% | 11 | 1.98 / 4.79 |
| Q1 FY2027 | Dividend per share | 0.00 | — | — | — / — |
| Q1 FY2027 | Gross margin | 13.2% | 11.3% | — | — / — |
| Q1 FY2027 | Capital expenditure | -40.76 | 23.5% | — | — / — |
| Q1 FY2027 | Net debt | -2,175 | 277.5% | — | — / — |
| Q1 FY2027 | ROE | 23.0% | 153.7% | — | — / — |
| Q1 FY2027 | Cash from operations | 177.0 | -76.8% | — | — / — |
Estimate momentum
Those reductions largely predate the last 30 days, over which both years' revenue and EPS have been broadly stable to slightly higher.
Currency: USD · Scale: money in millions, absolute (per share) · Point-in-time consensus; analyst count is shown where supplied.
| Period | Metric | Lookback | Then | Now | Direction / magnitude | Analysts |
|---|---|---|---|---|---|---|
| 2028 | Revenue | 30d | 49,540 | 50,434 | up 1.8% | — |
| 2028 | Revenue | 90d | 49,155 | 50,434 | up 2.6% | — |
| 2028 | Revenue | 180d | 52,122 | 50,434 | down 3.2% | — |
| 2027 | EPS (normalized) | 30d | 9.26 | 9.29 | up 0.3% | — |
| 2027 | EPS (normalized) | 90d | 8.20 | 9.29 | up 13.4% | — |
| 2027 | EPS (normalized) | 180d | 16.34 | 9.29 | down 43.1% | — |
| 2027 | Revenue | 30d | 47,249 | 47,524 | up 0.6% | — |
| 2027 | Revenue | 90d | 46,671 | 47,524 | up 1.8% | — |
| 2027 | Revenue | 180d | 50,371 | 47,524 | down 5.7% | — |
| 2028 | EPS (normalized) | 30d | 12.34 | 12.93 | up 4.8% | — |
| 2028 | EPS (normalized) | 90d | 12.51 | 12.93 | up 3.4% | — |
| 2028 | EPS (normalized) | 180d | 25.09 | 12.93 | down 48.4% | — |
Beat / miss record
Current sequences by metric: Revenue: 1 consecutive miss; EPS (normalized): 1 consecutive beat.
Currency: USD · Scale: money in millions, absolute (per share) · Consensus is captured before each actual first became effective; analyst count shown per observation.
| Quarter | Metric | Consensus as of | Actual | Surprise | Outcome | Analysts |
|---|---|---|---|---|---|---|
| Q1 FY2026 | Revenue | 10,886 | 10,796 | -0.8% | Miss | — |
| Q1 FY2026 | EPS (normalized) | 1.91 | 2.35 | 23.0% | Beat | — |
| Q4 FY2025 | Revenue | 10,905 | 11,375 | 4.3% | Beat | — |
| Q4 FY2025 | EPS (normalized) | 0.33 | -2.75 | -921.5% | Miss | — |
| Q3 FY2025 | Revenue | 10,984 | 11,477 | 4.5% | Beat | — |
| Q3 FY2025 | EPS (normalized) | 3.89 | 1.84 | -52.7% | Miss | — |
| Q2 FY2025 | Revenue | 10,941 | 11,427 | 4.4% | Beat | — |
| Q2 FY2025 | EPS (normalized) | 5.53 | 5.48 | -0.9% | Miss | — |
| Q1 FY2025 | Revenue | 10,814 | 11,147 | 3.1% | Beat | — |
| Q1 FY2025 | EPS (normalized) | 5.96 | 6.08 | 2.1% | Beat | — |
| Q4 FY2024 | Revenue | 10,319 | 10,499 | 1.7% | Beat | — |
| Q4 FY2024 | EPS (normalized) | 5.88 | 5.05 | -14.2% | Miss | — |
| Q3 FY2024 | Revenue | 9,912 | 10,340 | 4.3% | Beat | — |
| Q3 FY2024 | EPS (normalized) | 5.94 | 6.01 | 1.1% | Beat | — |
| Q2 FY2024 | Revenue | 9,754 | 9,880 | 1.3% | Beat | — |
| Q2 FY2024 | EPS (normalized) | 5.68 | 5.86 | 3.2% | Beat | — |
Where the street disagrees
Currency: USD · Scale: money in millions, absolute (per share) · Dispersion is high-low divided by absolute mean; analyst count shown per item.
| Period | Metric | Mean | Low | High | Spread / mean | Analysts |
|---|---|---|---|---|---|---|
| Q4 FY2026 | EPS (normalized) | 0.13 | -1.15 | 0.85 | 1563.0% | 18 |
| Q4 FY2026 | EPS (GAAP) | -0.14 | -1.44 | 0.42 | 1287.7% | 6 |
| Q4 FY2026 | Net income (GAAP) | -7.93 | -73.51 | 22.54 | 1210.8% | 8 |
| Q4 FY2025 | Net income (GAAP) | -5.11 | -34.71 | 15.00 | 973.5% | 7 |
| Q4 FY2025 | EPS (GAAP) | -0.17 | -0.68 | 0.15 | 478.2% | 5 |
Source: Visible Alpha consensus via S&P Xpressfeed · Consensus as of 2026-07-14 · generated 2026-07-17.
Model trust
This reads as a broad, timely consensus rather than a narrow or stale one.
Base currency: USD · VA scales normalized from Abs, M; item currencies and units retained · Coverage depth and vintage; broker count is the maximum represented.
| Brokers | Line items | Last revision |
|---|---|---|
| 14 | 314 | 2026-07-14 |
Operating KPIs
Base currency: USD · VA scales normalized from Abs, M; item currencies and units retained · FY-1A / FY0E / FY+1E; broker count shown per KPI.
| Operating KPI | Source | FY-1A | FY0E | FY+1E | Brokers |
|---|---|---|---|---|---|
| General and administrative expenses | CD | 2,952,707.24bn Amount | 2,906,178.34bn Amount | 3,092,677.69bn Amount | 14 |
| Medical care costs | CD | 39,071,602.51bn Amount | 38,951,976.71bn Amount | 42,418,451.87bn Amount | 14 |
| Premium revenue | CD | 42,779,644.46bn Amount | 42,105,377.33bn Amount | 46,042,367.97bn Amount | 14 |
| Premium tax expenses | CD | 1,724,224.62bn Amount | 2,023,000.07bn Amount | 2,033,030.93bn Amount | 14 |
| Depreciation and amortization | CD | 198,992.73bn Amount | 166,937.45bn Amount | 179,809.03bn Amount | 13 |
| General and Administrative Expenses - Operating | CD | 2,923,424.96bn Amount | 2,876,538.47bn Amount | 3,098,461.35bn Amount | 13 |
| General and administrative ratio - Operating(%) | CD | 6.5% | 6.4% | 6.3% | 13 |
| General and administrative ratio(%) | CD | 6.6% | 6.5% | 6.4% | 13 |
| Medical cost ratio - Life and Health Insurance(%) | CD | 91.3% | 92.5% | 92.1% | 13 |
| Medical cost ratio(%) | CD | 91.3% | 92.5% | 92.1% | 13 |
| Medical margin | CD | 3705588222.4% | 3158867777.5% | 3659974284.4% | 13 |
| Premium Revenue - Marketplace | CD | 4,576,880.29bn Amount | 2,666,145.20bn Amount | 2,609,649.79bn Amount | 13 |
P&L bridge
Base currency: USD · VA scales normalized from Abs, M; item currencies and units retained · Margins are derived against revenue; YoY compares adjacent fiscal columns; broker count shown per line.
| P&L line | FY-1A | FY0E | FY+1E | Brokers |
|---|---|---|---|---|
| Revenue | 45,030,856.77bn Amount | 44,588,465.14bn Amount (-1.0% YoY) | 48,554,889.24bn Amount (8.9% YoY) | 14 |
| Gross Profit | 5,955,852.13bn Amount (13.2% margin) | 5,636,488.43bn Amount (12.6% margin; -5.4% YoY) | 6,136,437.37bn Amount (12.6% margin; 8.9% YoY) | 14 |
| Ebitda | 1,220,414.75bn Amount (2.7% margin) | 682,445.22bn Amount (1.5% margin; -44.1% YoY) | 973,223.29bn Amount (2.0% margin; 42.6% YoY) | 12 |
| Operating Income | 1,093,858.88bn Amount (2.4% margin) | 522,112.47bn Amount (1.2% margin; -52.3% YoY) | 859,378.39bn Amount (1.8% margin; 64.6% YoY) | 11 |
| Net Income | 742,008.42bn Amount (1.6% margin) | 263,464.94bn Amount (0.6% margin; -64.5% YoY) | 480,672.20bn Amount (1.0% margin; 82.4% YoY) | 14 |
| Eps | 13.95 Amount | 5.17 Amount (-62.9% YoY) | 9.94 Amount (92.1% YoY) | 14 |
Consensus dispersion
The debate is therefore about how deep and durable the earnings trough proves, not about premium growth or the reported cost ratio.
Base currency: USD · VA scales normalized from Abs, M; item currencies and units retained · Top high-low spreads relative to absolute mean; requires at least 3 brokers.
| Line item | Period | Mean | Min | Q1 | Q3 | Max | Spread / mean | Brokers |
|---|---|---|---|---|---|---|---|---|
| EPS Diluted, Applicable to common stockholders($) | 4QFY-2026 | 0.11 Amount | -1.15 Amount | -0.07 Amount | 0.44 Amount | 0.85 Amount | 1892.6% | 14 |
| Net income/(loss), Applicable to common stockholders | 4QFY-2026 | 5,415.86bn Amount | -58,780.73bn Amount | -3,455.96bn Amount | 22,248.10bn Amount | 43,374.80bn Amount | 1886.2% | 14 |
| EPS Diluted, Applicable to common stockholders($) | 4QFY-2025 | 0.35 Amount | -0.33 Amount | 0.35 Amount | 0.42 Amount | 0.86 Amount | 339.1% | 12 |
| Net income/(loss), Applicable to common stockholders | 4QFY-2025 | 18,036.50bn Amount | -16,882.48bn Amount | 17,723.69bn Amount | 22,072.52bn Amount | 43,860.08bn Amount | 336.8% | 12 |
| Operating income/(loss) | 4QFY-2026 | 60,115.85bn Amount | -30,146.79bn Amount | 54,469.81bn Amount | 81,828.32bn Amount | 101,726.30bn Amount | 219.4% | 11 |
| Depreciation and amortization | 1QFY-2026 | 52,179.17bn Amount | 35,854.85bn Amount | 45,104.96bn Amount | 50,222.90bn Amount | 107,500.00bn Amount | 137.3% | 12 |
Quarterly path
Base currency: USD · VA scales normalized from Abs, M; item currencies and units retained · Next four supplied quarters; final column is maximum broker coverage in the row.
| Quarter | General and administrative expenses | Medical care costs | Premium revenue | Premium tax expenses | Depreciation and amortization | Total revenue | EPS Diluted, Applicable to common stockholders($) | Broker coverage |
|---|---|---|---|---|---|---|---|---|
| 3QFY-2026 | 688,498.98bn Amount | 9,602,838.09bn Amount | 10,356,524.10bn Amount | 498,747.53bn Amount | 41,875.33bn Amount | 10,972,436.66bn Amount | 1.27 Amount | 14 |
| 4QFY-2026 | 740,368.84bn Amount | 10,581,440.72bn Amount | 11,303,521.10bn Amount | 542,415.13bn Amount | 43,529.23bn Amount | 11,964,380.95bn Amount | 0.11 Amount | 14 |
| 1QFY-2027 | 800,985.96bn Amount | 10,207,405.38bn Amount | 11,195,513.01bn Amount | 495,546.60bn Amount | 44,208.91bn Amount | 11,810,959.59bn Amount | 3.16 Amount | 13 |
| 2QFY-2027 | 753,578.44bn Amount | 10,447,532.79bn Amount | 11,344,085.32bn Amount | 483,877.07bn Amount | 45,782.89bn Amount | 11,949,102.00bn Amount | 2.53 Amount | 13 |
38 stale period values omitted; 2 line items fully removed.
Source: S&P Capital IQ transcripts via Xpressfeed · latest indexed call 2026-04-23 · generated 2026-07-17.
Latest call digest
Molina Healthcare, Inc., Q1 2026 Earnings Call, Apr 23, 2026 · 2026-04-23T12:00:00
Q1 2026 — reported April 23, 2026. Molina posted adjusted EPS of $2.35 on $10.2 billion of premium revenue, a 91.1% consolidated MCR and a 1.6% adjusted pretax margin. By segment, Medicaid ran a 92% MCR (January rate updates in line, trend modestly favorable), Medicare 89.8% (the newly converted FIDE/HIDE duals products off to a good start), and Marketplace 84% on 305,000 members after the deliberate exposure cut.
The prepared remarks and the Q&A diverged on one point: management called the quarter "solid" and modestly favorable, yet only reaffirmed full-year guidance of approximately $42 billion of premium and at least $5 of adjusted EPS rather than raising it. Full-year segment assumptions were left unchanged — Medicaid MCR 92.9% (4% rates, 5% trend), Medicare 94%, Marketplace 85.5%, G&A ~6.4%, with roughly two-thirds of earnings weighted to the first half and Florida CMS implementation weighing on the fourth quarter.
The Q&A was dominated by two pressures: whether the assumption of no further acuity shift is credible now that low-and-no-utilizers sit at the lowest level Molina has recorded, and why guidance was not raised. Management repeatedly invoked a "time tested" preference for two quarters of data after 2025's volatility. The one guidance change surfaced in Q&A: same-store Medicaid attrition was lifted from a 2% to a 6% decline (California, Illinois, New York, Texas — California driven by the undocumented-immigrant population), with the revenue loss offset by higher Marketplace revenue so premium is unchanged. A May 8 Investor Day was flagged for the 2029 outlook.
Participant coverage from the latest call.
| Group | Participants | Count |
|---|---|---|
| Management | Operator; Jeffrey Geyer — Head of Investor Relations, Molina Healthcare, Inc.; Joseph Zubretsky — President, CEO & Director, Molina Healthcare, Inc.; Mark Keim — Senior EVP, CFO & Treasurer, Molina Healthcare, Inc. | 4 |
| Analysts | Andrew Mok — Director, Barclays Bank PLC, Research Division; Stephen Baxter — Senior Equity Analyst, Wells Fargo Securities, LLC, Research Division; Ann Hynes — Managing Director of Americas Research & Senior Healthcare Services Equity Analyst, Mizuho Securities USA LLC, Research Division; Kevin Fischbeck — Managing Director in Equity Research, BofA Securities, Research Division; Justin Lake — MD & Senior Healthcare Services Analyst, Wolfe Research, LLC; Sarah James — Research Analyst, Cantor Fitzgerald & Co., Research Division; Albert Rice — Health Care Services Analyst, UBS Investment Bank, Research Division; Scott Fidel — Research Analyst, Goldman Sachs Group, Inc., Research Division; John Stansel — Analyst, JPMorgan Chase & Co, Research Division; Erin Wilson Wright — Equity Analyst, Morgan Stanley, Research Division; Ryan Langston — Director & Senior Analyst, TD Cowen, Research Division; Hua Ha — Senior Research Analyst, Robert W. Baird & Co. Incorporated, Research Division; Lance Wilkes — Senior Analyst, Bernstein Institutional Services LLC, Research Division; George Hill — MD & Equity Research Analyst, Deutsche Bank AG, Research Division; Jason Cassorla — VP & Equity Research Analyst, Guggenheim Securities, LLC, Research Division | 15 |
Curated latest-call exchanges; one row per analyst topic.
| Analyst | Firm | Topic | What changed in Q&A |
|---|---|---|---|
| Andrew Mok | Barclays | Higher Medicaid attrition | Pressed which states drive the incremental membership pressure; management named California, Illinois, New York and Texas, with California tied to the undocumented-immigrant population, and argued no associated acuity shift. |
| Stephen Baxter | Wells Fargo | Acuity-shift assumption | Questioned whether zero further acuity shift is a reasonable baseline given how tightly enrollment is now managed; management pointed to low/no-utilizers at their lowest recorded level and stayer/leaver ratios near portfolio average. |
| Kevin Fischbeck | BofA Securities | Why guidance not raised | Asked whether holding guidance is routine Q1 caution or reflects real unquantifiable unknowns; management said the indicators are positive but a two-quarter, time-tested base is prudent after 2025's volatility. |
| Justin Lake | Wolfe Research | Medicaid trend composition | Sought quarterly trend figures and the acuity-versus-core split by cost category; management gave pure-period color but declined a clean quarterly breakout, citing seasonality and noise. |
| Scott Fidel | Goldman Sachs | Medicare duals vs. exiting MAPD | Asked to parse continuing duals MCR from the MAPD book being exited; management framed the 2027 duals-only structure and cited a ~$5.5 billion, ~94% MLR run rate. |
| Michael Ha | Baird | Low/no-utilizer definition | Pushed for the MLR buckets that define low utilizers; management declined to disclose the definition or absolute numbers, saying the directional decline holds across every definition tested. |
| George Hill | Deutsche Bank | 2027 work requirements | Asked how states will administer community-engagement/work requirements; management cited early-mover insight from Nebraska but flagged that CMS guidance on ex-parte and medical-frailty rules remains unclear. |
Theme tracker
Themes are curator-classified across supplied calls.
| Theme | Status | Quarters mentioned | Read-through |
|---|---|---|---|
| Medicaid rate/trend imbalance and market underfunding | persisted | Q3 2024, Q4 2024, Q1 2025, Q2 2025, Q3 2025, Q4 2025, Q1 2026 | The central margin debate. Framing hardened from 2023-early-2024's "actuarially sound" rates to a recurring claim that the managed-Medicaid market is 300-400 bps underfunded, with Molina positioned as best-in-class within it. Each 100 bps of Medicaid MCR is repeatedly tied to roughly $4.50-$5 of EPS, making rate restoration the key swing factor. |
| Redetermination acuity shift and low/no-utilizer analysis | persisted | Q2 2023, Q3 2023, Q4 2023, Q1 2024, Q3 2024, Q4 2024, Q1 2025, Q2 2025, Q3 2025, Q4 2025, Q1 2026 | Present every quarter but the tone inverted: "negligible" in 2023, a ~250 bps drag on 2025 trend, and now argued to be "largely behind us." The low/no-utilizer statistic and stayer/leaver analysis became the core evidentiary prop across the two most recent calls. |
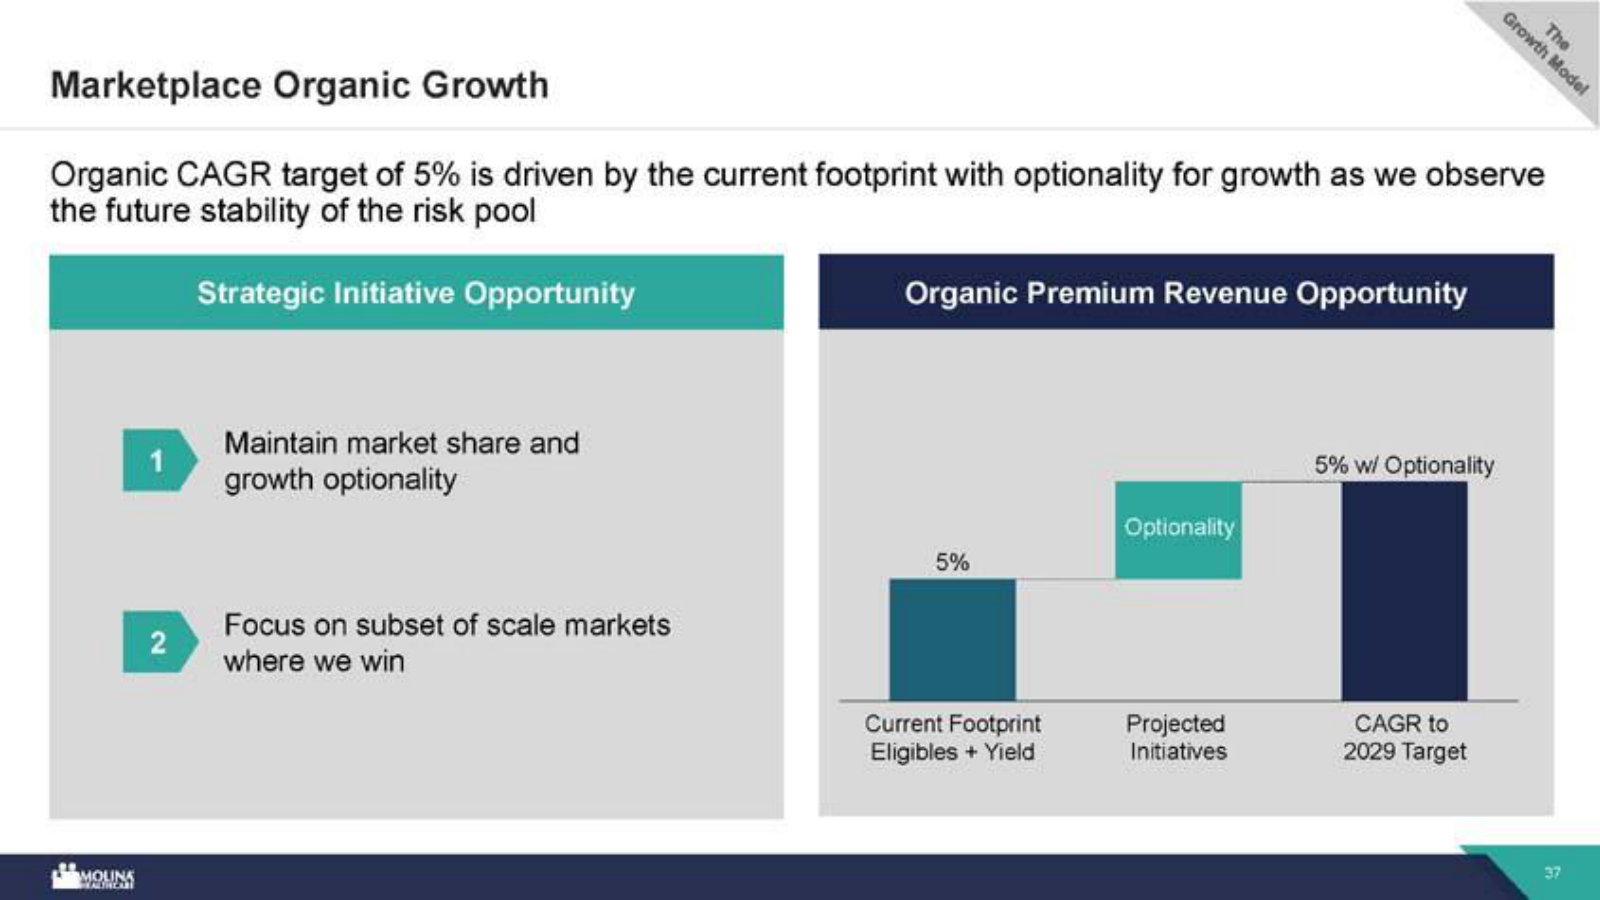
| Marketplace de-risking and exposure reduction | emerged | Q2 2025, Q3 2025, Q4 2025, Q1 2026 | Emerged mid-2025 as enhanced-subsidy expiration and risk-pool volatility drove a ~30% average repricing, a ~20% county-footprint cut and a planned ~50% premium decline. A clear strategic reversal from the prior posture. |
| Marketplace as a growth engine funded by reinvested excess margin | dropped | Q4 2023, Q1 2024, Q2 2024, Q4 2024, Q1 2025 | Through early 2025 Molina touted two years of sub-target Marketplace MCRs (~75%) and reinvested "excess margin" to grow ~60%. That growth narrative disappeared as the segment pivoted to deliberate shrinkage — the dropped framing is itself signal about the risk pool. |
| Risk-corridor protection as a margin buffer | dropped | Q2 2023, Q3 2023, Q4 2023, Q1 2024, Q2 2024, Q3 2024, Q4 2024 | Corridors (~200 bps of protection) were a frequent talking point through 2024. By Q3 2025 protection was "very limited," and recent calls barely mention it — the cushion that muted early trend pressure has effectively lapsed from the story. |
| Medicare pivot to integrated duals (MMP to FIDE/HIDE) and MAPD exit | emerged | Q3 2024, Q4 2024, Q1 2025, Q3 2025, Q4 2025, Q1 2026 | The duals-integration transition built through 2024-2025 and crystallized into a decision to exit traditional MAPD for 2027, cited as a ~$1 EPS drag in 2026 that reverses. Positions Medicare as a duals-only franchise aligned with Medicaid integration. |
| Embedded earnings as forward value marker | persisted | Q2 2023, Q3 2023, Q4 2023, Q1 2024, Q2 2024, Q3 2024, Q4 2024, Q1 2025, Q2 2025, Q3 2025, Q4 2025, Q1 2026 | A fixture every call, growing from ~$4 to greater than $11 per share as RFP wins (Georgia, Texas, the $6bn Florida CMS contract) and acquisitions accumulated. Management leans on it to argue current depressed EPS understates franchise value. |
Guidance ledger
Quotes, calls, and speakers are source-verified; outcomes are curator-classified.
| Verbatim guidance | Call | Speaker | Curator outcome | Outcome note |
|---|---|---|---|---|
| “We project 2025 premium revenue of approximately $42 billion and adjusted earnings per share of at least $24.50” | Molina Healthcare, Inc., Q4 2024 Earnings Call, Feb 06, 2025 · 2025-02-06T13:00:00 | Joseph Zubretsky | missed | Full-year 2025 adjusted EPS ultimately came in at $11.03, less than half this initial guide, on 2025's Medicaid, Medicare and Marketplace trend pressure. |
| “Our full year 2025 adjusted earnings per share guidance is now expected to be approximately $14 per share” | Molina Healthcare, Inc., Q3 2025 Earnings Call, Oct 23, 2025 · 2025-10-23T12:00:00 | Joseph Zubretsky | missed | This mid-year cut (from a prior $19) still proved optimistic; the Q4 retro items in California and continued trend pressure took actual FY2025 adjusted EPS to $11.03. |
| “we are well on our way to meeting our target of $46 billion of premium revenue in 2026 and at least $52 billion in 2027” | Molina Healthcare, Inc., Q4 2024 Earnings Call, Feb 06, 2025 · 2025-02-06T13:00:00 | Joseph Zubretsky | missed | The $46 billion 2026 revenue target was withdrawn; 2026 premium is now guided to approximately $42 billion, chiefly on the planned Marketplace reduction and Georgia/Texas contracts slipping to 2027. |
| “Our 2026 adjusted earnings per share guidance is at least $5.” | Molina Healthcare, Inc., Q4 2025 Earnings Call, Feb 06, 2026 · 2026-02-06T13:00:00 | Joseph Zubretsky | pending | Reaffirmed on the Q1 2026 call despite a modestly favorable first quarter; management is holding rather than raising pending second-quarter results. |
| “In Medicaid, the full year MCR of 92.9% includes rate increases of 4% and medical cost trend at 5%.” | Molina Healthcare, Inc., Q1 2026 Earnings Call, Apr 23, 2026 · 2026-04-23T12:00:00 | Mark Keim | pending | Q1 2026 Medicaid ran a 92% MCR with trend modestly favorable, and management said Q1 annualized trend would land below 5%; the full-year outcome is not yet determinable. |
Q&A pressure map
Question counts and firms are curator tallies; analyst coverage shown above.
| Topic | Questions | Firms | Pressure / response |
|---|---|---|---|
| Acuity-shift risk and the low/no-utilizer assumption | 4 | Barclays, Wells Fargo, Baird, Deutsche Bank | The hardest-pressed topic on the latest call and a recurring one across 2025. Analysts repeatedly tested whether "no further acuity shift" holds now that enrollment is tightly managed. Management leaned on stayer/leaver data and the low/no-utilizer statistic but declined to disclose its definition or the underlying numbers, a non-disclosure worth flagging even though the thrust of each question was addressed. |
| Refusal to raise guidance after a favorable quarter | 3 | BofA Securities, Morgan Stanley, UBS | Analysts pushed on whether the caution signals specific unknowns; management consistently answered that nothing unusual occurred in Q1 and that a two-quarter, "time tested" base is simply prudent after 2025's volatility. |
| Medicaid cost-trend composition and cadence | 2 | Wolfe Research, Bernstein | Requests for quarterly trend figures and an acuity-versus-core split were met with pure-period color rather than a clean quarterly breakout, which management declined citing seasonality and noise. |
| Medicare duals economics ahead of the MAPD exit | 2 | Goldman Sachs, TD Cowen | Analysts sought run-rate visibility on the continuing duals book separate from the MAPD product being exited for 2027, and an update on efforts to transfer rather than wind down MAPD. |
Language shifts
Only language evidence verified against the referenced component is shown.
| Observation | Verbatim evidence | Call ID | Component |
|---|---|---|---|
| Baseline confidence before the deterioration: in early 2025 management framed long-term targets as firmly achievable, language that later gave way to loss-quarter caveats. | “remain very confident in our ability to achieve the long-term targets that we shared with you at our November Investor Day” | 1914754214 | 2 |
| New risk vocabulary entered the script as full-year 2025 results fell to an adjusted loss quarter — 2025 trend recast as an outlier rather than a new normal. | “We believe the medical cost trend in 2025 was an aberration, an anomaly by historical standards.” | 1975844137 | 2 |
| Introduction of explicit "trough" framing, positioning 2026 as the bottom of the Medicaid margin cycle rather than a further step down. | “We believe our 2026 forecast for Medicaid is the trough for managed Medicaid margins.” | 1975844137 | 2 |
| Even after a favorable quarter, prudence dominates over renewed confidence; guidance is treated as data-gated, echoing the repeated "time tested" refrain. | “merely reaffirming our prior full year guidance is a prudent approach at this early point in the year and in this current environment.” | 1986884066 | 2 |
The call history sets up a clean question. Management's thesis is that 2025's margin collapse was driven by a redetermination acuity shift that is now spent and by Medicaid rates that states will restore; Q1 2026 delivered the first data consistent with that. Unresolved is whether states close the claimed 300-400 bps of underfunding fast enough — and management's own refusal to raise guidance after a good quarter signals they want more proof too. The May 8 Investor Day and second-quarter results are the near-term arbiters.
Business and Thesis
Molina Healthcare collects fixed monthly premiums from governments to run health plans for roughly 5.5 million low-income and elderly Americans, keeping the thin spread between those premiums and the medical claims it pays. Revenue has tripled since 2020, to $45.4 billion. But in 2025 the spread compressed sharply: the medical care ratio jumped to 91.7%, net income halved to $472 million, and the stock fell more than 60% from its peak. Everything that follows examines whether that break is temporary.
What Molina is
Molina is a pure-play government managed-care company. It contracts with state Medicaid agencies, with the federal Medicare program, and with the Affordable Care Act insurance marketplaces to arrange health care for people enrolled in those programs, operating across 21 states with about 5.5 million members at the end of 2025 [1]. It sells nothing to consumers directly and takes no commercial-employer risk; its customers are governments, and its revenue is other people's health-care budgets.
The business is heavily weighted to Medicaid, the joint federal-state program for low-income families. Medicaid supplied $32.2 billion of 2025 premium revenue against $6.2 billion from Medicare and $4.5 billion from the marketplaces — roughly three of every four premium dollars come from state Medicaid contracts [2].
Source: FY2025 Form 10-K segment revenue disclosures [3].
How it makes money
The economics are simple to state and hard to run. A state pays Molina a fixed per-member, per-month (PMPM) rate, set annually and required to be actuarially sound; in return, Molina assumes the medical and administrative cost risk for those members [4]. Molina keeps whatever premium is left after paying claims and running the plan. Because premiums are fixed by contract for the year while medical costs are not, the margin is most sensitive to one ratio — the share of each premium dollar consumed by medical claims. Molina calls it the medical care ratio (MCR); the rest of the industry calls it the medical loss ratio. In Molina's own words, if premiums do not rise as fast as medical costs and utilization, "our medical margins will be compressed or eliminated, and our earnings will be negatively affected" [5].
The arithmetic leaves little room. In 2025, medical claims took 91.7 cents of every premium dollar and general and administrative costs took another 6.6 cents, leaving an operating margin under 2% and a net margin near 1% [6]. This is a business that converts $45 billion of revenue into roughly $0.5 billion of net profit by design — a low-margin, high-volume premium aggregator whose returns come from scale and cost control, not pricing power.
Total Revenue (FY2025)
Net Income
Diluted EPS
Medical Care Ratio
Source: FY2025 Form 10-K financial highlights; MCR is medical costs as a percentage of premium revenue [7].
Five years of growth, then a profit round-trip
Revenue tripled between 2020 and 2025, from $19.4 billion to $45.4 billion [8]. Almost none of that came from adding members organically — the count rose only from about 4.0 million to 5.5 million — and most came from acquisitions, state contract wins, higher-acuity membership, and rate increases. The 2025 growth alone leaned on the ConnectiCare acquisition, Medicaid rate increases, and marketplace expansion [9].
Profit did not follow the same line. Net income climbed toward $1.2 billion by 2024, then fell back to $472 million in 2025 — below where it stood in 2020 on more than double the revenue [10].
Source: revenue and net income as reported in FY2021 and FY2025 Form 10-Ks; 2020–2021 [11], 2024–2025 [12].
What went wrong in 2025
The divergence traces to the medical care ratio. It held near 88% for four straight years — a level Molina describes as its long-term target — before edging to 89.1% in 2024 and then jumping to 91.7% in 2025, a 260-basis-point move [13]. On roughly $43 billion of premium, each point of MCR is worth about $430 million of pre-tax margin, so the two-and-a-half point move explains most of the profit collapse. Molina attributes it to medical cost trend and utilization running higher than expected, plus acuity shifts in its membership as post-pandemic Medicaid eligibility redeterminations removed healthier members [14].
Source: consolidated MCR as reported; 2020–2021 [15], 2024–2025 [16]; 2022–2023 from the respective 10-Ks.
Management's read is that this is a rate problem, not a demand problem. On the July 2025 call, chief executive Joseph Zubretsky called the pressure "a temporary dislocation between premium rates and medical cost trend," adding that "nothing has changed our outlook for the long-term performance of the business" [17]. The logic: because state and federal rates reset annually and lag the cost trend, an acceleration in claims first compresses margin and later gets repriced into the next year's premiums. The counter-case is that the redetermination-era acuity shift is a level change in who Molina insures, not a timing gap that reprices away. The four-year stability at 88% and the isolated 2025 spike are consistent with the first reading; whether the ratio returns toward 88% or settles higher is the question later chapters test.
What the stock did
The market treated 2025 as more than a one-year miss. Molina traded above $400 in early 2024 and near $355 as late as April 2025, then fell to an intraday low around $123 in early 2026 — a drawdown of more than 65% — before recovering to about $225 by mid-July 2026. The decline in market value has been far larger, in percentage terms, than the decline in reported earnings, which is the kind of gap that draws value investors to look closer.
Source: NYSE market data, year-end closing prices; 2026 value is the close on 16 July 2026 (as reported).
The through-line this report answers
Molina is a low-margin aggregator of government-funded health plans that has tripled its revenue in five years, carries a net-cash balance sheet, and has just posted its worst medical margin in at least six years while its stock has more than halved.
This report tests whether Molina can keep compounding its government-sponsored premium base for another decade while earning a stable enough medical margin to turn today's depressed, volatile cash flow into durably higher free cash flow — or whether the 2025 margin break is a structural feature of a thin-spread, rate-lagged business rather than the temporary dislocation management describes.
That question has three parts, and each is a claim to be tested rather than assumed. The first is durability of the top line: whether a Medicaid-heavy revenue base is more or less reliable a decade out than it looks today, given how much of it rides on annual state appropriations and periodic contract rebids. The second is the margin: whether 91.7% is a cyclical peak that reprices back toward 88%, or a new floor. The third is cash: Molina's reported operating cash flow has swung from a $2.1 billion inflow to a $535 million outflow across these same years, driven by the timing of government receivables and payables rather than by the underlying economics [18] — a pattern that a cash-focused investor cannot take at face value and that a later chapter unpacks in full.
On the evidence so far, the growth question looks the most answerable in Molina's favor and the margin question the most genuinely open. What would change that read is straightforward to name: evidence that the 2025 acuity shift is permanent, or that state rates are structurally lagging cost trend rather than catching up, would move the margin from cyclical to structural.
Revenue Durability
Molina has no moat in the ordinary sense. Its customers are roughly forty state Medicaid agencies that put their business out to competitive bid on three-to-five-year cycles, and four states supply 54% of Medicaid premium [1]. What stands in for a moat is an operational track record that has retained reprocurements and won new states for a decade, feeding a market that grows structurally. The ten-year revenue question is answerable yes with reasonable confidence — but the near-term direction is down.
The customer is a bidding process, not a captive base
Whether revenue can be higher in year ten turns first on how Molina's revenue is held. It is held by contract, not by captivity. States select managed-care plans "by using a formal bid process," and Molina's Medicaid contracts "typically have terms of three to five years," carry renewal options the state controls, and let either side "terminate the contract with or without cause." When a state rebids through a request-for-proposal, "if one of our health plans is not a successful responsive bidder to such RFPs, its contract may not be renewed" [2].
That is the opposite of a switching-cost business. There is no brand pricing power — in Medicaid the plan is "essentially [a] rate taker," paid a fixed per-member rate set by the state [3]. And the revenue rests on a thin base of contracts: Molina operates "as a direct contractor with the states," and "the loss of any one of those contracts could have a material adverse effect" [4]. Whatever durability exists has to come from Molina winning the bids, not from customers being unable to leave.
What the track record shows instead
The evidence that Molina wins the bids is a decade long. Since it began its growth strategy in 2019, the company reports "a highly successful track-record of winning state RFPs," retaining reprocurements across the great majority of its footprint [5]. New-state procurements added roughly $7B of premium realized between 2019 and 2024, and bolt-on acquisitions added about $9B of premium over the same window [6]. The most recent proof point is Florida's Children's Medical Services program — a roughly $6 billion award management calls "one of the largest awards in Managed Medicaid history," carrying an estimated $2.00 of EPS at full implementation [7].
The long revenue arc is the cleanest test of durability, and it passes. Revenue roughly tripled over the last five years and is about 2.5x its level a decade ago — and it did so through a genuine crisis. In 2017 Molina posted a net loss of about $512 million; it restructured, and revenue and profit recovered and then compounded.
Source: derived from reported financials, FY2016–FY2025 (company filings, as reported); FY2017 reflects a net loss of about $512M.
The point is not that the past guarantees the future, but that the win-and-retain track record has been observed working across many procurement cycles and the 2017 loss year. For a business with no captive customers, a demonstrated ability to keep winning is the durable asset — an operational and scale advantage, not a brand.
The concentration that a rebid can expose
The same thin-contract structure that makes the win rate load-bearing also makes concentration a real risk. Molina's top four health plans — California, New York, Texas, and Washington — carried aggregate Medicaid premium of $17.3 billion in 2025, about 54% of total Medicaid premium; Medicaid itself is 75% of consolidated premium [8]. Measured against total premium, California, Texas, and Washington were each at or above 10% [9].
States
Medicaid % of Premium
Top 4 States, % of Medicaid Premium
FY2026 Premium Guide ($B)
Source: FY2025 Form 10-K, Item 1A [10]; FY2026 guidance per company disclosure [11].
Each of these contracts comes up for rebid on its own clock. California's Medi-Cal contracts recommenced in January 2024, and Texas STAR+PLUS was retained and expanded on a new contract from September 2024 [12]. Washington — one of the four — is the near-term watch item: the state is expected to re-procure its Medicaid business with an RFP no earlier than the fourth quarter of 2026 and a new contract effective January 1, 2028 [13]. The base case, on the track record, is retention; the tail risk is that a single lost rebid removes a tenth of the premium book at once.
Sources: FY2025 Form 10-K, Item 1 [14] and Note 2 [15]; Washington timing per FY2025 Form 10-K [16]. Blank cells not separately disclosed.
The policy overhang, and why 2026 goes backward
Winning bids protects Molina's share of the Medicaid pie; it does not protect the size of the pie. That is set in Washington and the state capitals, and for the first time in years it is contracting. Two federal changes bear directly on the ten-year top line.
First, the One Big Beautiful Bill Act, enacted July 2025, adds Medicaid work requirements and more frequent eligibility reverifications for the expansion population, phasing in from 2027. Management estimates the ultimate hit at 15% to 20% of its 1.3 million expansion members, arguing many will keep coverage through exclusions or because they already work; harder to size are the indirect effects of federal funding cuts to directed payments and provider taxes, which could push states to trim eligibility or benefits over 2027–2029 [17]. Second, the enhanced ACA subsidies that inflated Marketplace enrollment expired at the end of 2025, and a new program-integrity rule tightens eligibility from 2026 [18]. Molina had already chosen to keep Marketplace to about 10% of its book and let it shrink [19].
The result is a rare reversal. Molina guides FY2026 premium revenue to about $42 billion [20] — below the $43.1 billion of premium earned in 2025, with Medicaid enrollment expected roughly flat and a modest footprint contraction offset by the new Florida Kids contract from late 2026 [21]. The speed of that mark-down is its own data point: as recently as July 2025 management still targeted about $46 billion of 2026 premium and at least $52 billion for 2027 [22]. Seven months later the 2026 number was roughly $4 billion lower. A book of business this exposed to annual rate resets and federal policy does not compound in a straight line.
Sources: FY2024/FY2025 premium per reported results; FY2026 guidance [23]; 2029 target of $64B premium per 2026 Investor Day [24].
Underwriting year ten
On the reader's specific bar — 90% confidence that revenue is higher in year ten than today — the evidence supports a yes, with the reasons stated plainly. The addressable market grows structurally: Medicaid and Medicare spending rises with an aging population and medical inflation regardless of Molina's share, and states keep outsourcing to managed care for budget predictability [25]. Molina has shown, across a decade and dozens of procurements, that it can hold and grow its slice through RFP wins and M&A [26]. Management's own 2029 target — roughly $64 billion of premium, about 50% above the 2026 trough — quantifies its confidence [27].
The strongest fact against the confident read is that the pie can shrink faster than share can be won: an unusually adverse combination of OBBBA eligibility losses, state funding cuts, and a lost top-four rebid could hold revenue flat or lower for years, and 2026 shows premium can decline year on year [28]. What would change the read is concrete and near-term: a lost Washington reprocurement in 2026–2028, or evidence that the indirect OBBBA funding cuts are prompting states to cut managed-care eligibility rather than backfill with their own revenue [29]. The base case is that revenue is materially higher in a decade; the case is more exposed to policy than to competition, and the durability is in the franchise's proven ability to keep winning, not in any customer's inability to leave.
The ten-year revenue case rests on a growing government-health market plus a proven win-and-retain engine, not on customer lock-in. It is most sensitive to federal and state policy on Medicaid eligibility and funding, and to the concentration of 54% of Medicaid premium in four separately-rebid state contracts.
Margin Reset
Molina's 2025 profit collapse was broad — all three insurance segments saw their medical care ratio rise — but the clearest evidence on whether the break is temporary or structural is not in any single ratio; it is in the targets management set for itself afterward. Between November 2024 and May 2026 Molina raised its long-term consolidated medical-care-ratio target by roughly 350 basis points (from 87.5-88.5% to 91-92%) and roughly halved its adjusted pre-tax margin target (from 4-5% to 2-3%); on February 4, 2026 it amended its credit agreement to cut the minimum interest-coverage covenant from 3.0x to 1.75x for 2026; and between July 2025 and February 2026 it cut its 2026 premium target from about $46 billion to roughly $42 billion — below the $43.05 billion it earned in 2025 — three separate, dated actions that each presume the earnings pressure endures rather than reverses [1] [2] [3] [4] [5] [6].
At the re-based 2–3% pre-tax margin, normalized adjusted EPS on today's revenue is roughly $16.80 (Valuation and Buybacks), against the $22.65 the old 4–5% margin produced in 2024; the re-basing, not the 2026 cyclical trough, is what sets the lower normalized level [7]. The strongest fact against reading that as a cap on earnings sits in the same arithmetic: management's bridge from the 2026 floor of "at least $5.00" to a 2029 target of $25.00 states that it "requires only a modest improvement in the Medicaid rate and trend imbalance" [8], so absolute earnings can still recover on volume and operating leverage even with the unit margin stepped down. The re-basing lowers the level; it does not cap the recovery.
The medical care ratio — medical costs as a share of premium — is the report's margin pillar because Molina keeps only what is left after claims. At a 91.7% consolidated MCR in 2025, that residual was 8.3 cents per premium dollar before administrative cost, against 10.9 cents in 2024 [9]. This chapter takes that ratio apart by segment, by reserve, and by management's own forward targets, and asks how much of the break reverses.
Management re-based its own targets
The strongest evidence on the "temporary versus structural" question is not in any single ratio; it is in the targets management sets for itself. In November 2024, Molina's stated three-year plan carried a consolidated medical-cost ratio of 87.5%–88.5% and a pre-tax margin of 4%–5% — the same 4%–5% range it had held as a long-term target for years and delivered (4.7%) across 2019–2024 [10] [11]. Eighteen months later, the 2029 targets set a consolidated MCR of 91%–92% and an adjusted pre-tax margin of 2%–3% [12].
Sources: 2024 Investor Day targets [13]; 2029 targets, 2026 Investor Day [14] [15]. Medicaid pre-2024 run-rate is the ~88% five-year band from the segment trail below.
Cutting a multi-year pre-tax margin target roughly in half is not the language of a passing dislocation. It is a company telling investors that the profitability of a government premium dollar has permanently stepped down — from roughly a nickel of pre-tax margin to two or three cents. The near term confirms the direction: management's own 2026 guidance projects consolidated MCR rising again to 92.6%, with Medicaid at 92.9% and Medicare at 94.0%, and adjusted EPS of only "at least $5.00" [16]. The first quarter of 2026 was consistent — a 91.1% consolidated MCR, net income of $14 million, and a $93 million impairment tied to the MAPD exit — with segment ratios of 92.0% Medicaid, 89.8% Medicare and 84.0% Marketplace [17] [18]. There is no snap-back in the data yet.
Every segment turned, and not for the same reason
Molina reports MCR for three insurance segments — Medicaid (about three-quarters of premium), Medicare, and Marketplace. All three deteriorated in 2025, but they tell different stories.
Source: segment medical care ratios as reported, FY2019–FY2025; FY2024–FY2025 figures per the FY2025 10-K segment table [19].
The Medicaid line carries the most weight. For five years it sat in a tight band near 88% — 88.0%, 87.4%, 88.7%, 88.0%, 88.7% from 2019 to 2023 — then stepped to 90.3% in 2024 and 91.8% in 2025 [20]. Management attributes the 150-basis-point 2025 rise to utilization "higher than we expected" across behavioral health, high-cost drugs and long-term services, plus acuity and product-mix shifts and unfavorable California retroactive premium items, "partially offset by premium rate increases" that "have lagged the increase in medical cost trend, resulting in a rate and trend imbalance that we believe to be temporary" [21].
Medicare rose 330 basis points to 92.4%, driven by high-acuity dual-eligible utilization and margin compression in the traditional Medicare Advantage prescription-drug (MAPD) product that Molina has since decided to exit for 2027 [22]. Marketplace is the most volatile and the least representative: its MCR jumped from 75.4% to 90.6%, but 75% was itself an unsustainable level — below the 80% floor the ACA imposes before rebates — inflated by favorable prior years and now hit by high-acuity special-enrollment members, the ConnectiCare acquisition, and CMS program-integrity actions that disenrolled members while Molina still bore their costs [23].
Sources: 2024–2025 actuals, FY2025 10-K [24]; 2026 guidance, Q4/FY2025 earnings release [25]; 2029 targets, 2026 Investor Day [26].
The pattern separates cleanly. Marketplace (guided to 85.5% for 2026 and a 80–85% target) and the loss-making MAPD line (being exited) are the recoverable, largely self-inflicted parts. The Medicaid core is not: management's own 2029 target for it is 91.5%–92.5% — essentially where 2025 landed, and roughly 350 basis points above the level Molina ran for half a decade [27].
Growth without margin
The clearest way to see the damage is in medical margin — premium minus medical costs, the segment profit Molina actually manages. In 2025 the company added $4.4 billion of premium and lost $635 million of medical margin [28].
Premium Change 2024→2025 ($M)
Medical Margin Change ($M)
Medical Margin / Premium 2025
▲ 10.9% 2024
Source: FY2025 10-K, segment premium and medical margin ($43,052M premium and $3,564M medical margin in 2025 vs $38,627M and $4,199M in 2024) [29].
Source: sum of segment medical margins as reported, FY2020–FY2025; 2024–2025 per the FY2025 10-K [30].
Medical margin had grown every year through 2024. Its 2025 fall is the first break in the series and the mechanism behind the earnings collapse a cold reader met earlier (Business and Thesis): a thin-spread aggregator earns on the gap between premium and cost, and in 2025 the gap narrowed while the book grew.
The reserve cushion that used to flatter the number
A managed-care insurer books claims it has not yet paid as an estimated liability, then trues it up as real claims arrive. When prior estimates prove too high, the excess is released as "favorable prior year development" — a recurring tailwind to the current year's reported medical costs. Molina's tailwind nearly vanished in 2025.
Source: FY2025 10-K, Medical Claims and Benefits Payable reconciliation — favorable prior-year development of $427M (2023), $675M (2024) and $98M (2025) [31]. Percentages are development as a share of that year's opening reserve.
Favorable development fell from $675 million in 2024 to $98 million in 2025 — from 16.1% of opening reserves to 2.1% [32]. This matters twice. First, the 2024 baseline against which the break is measured was itself flattered: a $675 million release is worth about 1.7 points of 2024 premium, so the "clean" 2024 ratio was closer to 91% than the reported 89.1% suggests, and the true year-on-year deterioration is smaller only because 2024 was better than it looked. Second, Marketplace flipped from favorable to $61 million of adverse development in 2025 — its 2024 reserves proved too low — which is what happens when a book grows fast into a deteriorating risk pool [33].
The fourth quarter carried the strain. Q4 2025 MCR reached 94.6% and the company reported a GAAP loss of $3.15 per share (an adjusted loss of $2.75), as the California retroactive items and reserve strengthening landed [34]. For the full year, adjusted diluted EPS fell to $11.03 from $22.65 [35].
What is temporary, and what is not
The measured read is that the break is largely structural at the margin level and largely recoverable at the earnings level — two different statements that are easy to conflate.
Structural: the normalized medical-cost ratio, on management's own targets, has re-based about 350 basis points higher and the pre-tax margin has roughly halved, led by a Medicaid core whose 2029 target sits at 2025's elevated level [36] [37]. On management's own targets, the normalized business is a 91–92%-MCR, 2–3%-pre-tax one rather than the 88%-MCR, 4–5%-pre-tax business it used to be.
Recoverable: absolute earnings can still climb even if the margin does not. Management's bridge from the 2026 floor of "at least $5.00" to a 2029 target of $25.00 leans on premium growth, operating leverage, the Marketplace and MAPD clean-up, M&A and buybacks — and states explicitly that it "requires only a modest improvement in the Medicaid rate and trend imbalance" [38]. In other words, the plan does not depend on Medicaid MCR returning to 88%; it depends on growing volume against a lower unit margin.
Sources: FY2024–FY2025 actual and FY2026 guidance ("at least $5.00"), Q4/FY2025 earnings release [39] [40]; FY2029 target of $25.00, 2026 Investor Day [41].
The near-term margin is guided worse before better: consolidated MCR of 92.6% in 2026 against 91.7% in 2025, and a return toward the 91–92% target only by 2029. The recovery in the numbers a reader can verify — quarterly MCR and reserve development — has not started.
Three things would change this read, and each is falsifiable in a filing. First, the Medicaid rate updates that states set for 2026 and 2027: if premium rate increases begin to catch cost trend, the "imbalance" thesis gains support and consolidated MCR should peak near the guided 92.6% and turn. Second, quarter-by-quarter consolidated MCR through 2026 in the 10-Qs — a decline below the guided path would be genuine evidence of the temporary case. Third, prior-year reserve development in the 2026 disclosures: another step down, or a turn to adverse beyond Marketplace, would signal that 2025 reserves were set too tight and that reported margins still overstate the run-rate [42]. Until those move, the prudent base case treats the lower margin as the new normal and the earnings recovery as a growth-and-leverage story that must be earned, not a margin snap-back that can be assumed.
Cash and Capital
Molina's reported operating cash flow was negative $535 million in 2025, its first annual outflow since 2018. Decomposed, the print is mostly government-payment settlement and tax timing, not economic cash burn: cash generation before working capital was roughly positive $754 million. But the reader's test — consistent, non-wavering operating cash — is not what the six-year record shows, and in February 2026 management amended a debt covenant that assumes 2026 earnings stay well below normal. This chapter reconciles the cash, locates it on the balance sheet, and reads the debt.
The negative headline, decomposed
The 2025 outflow is real, but it is not the income statement in disguise. Start from net income of $472 million, add back the non-cash charges every managed-care insurer carries — depreciation and amortization, deferred taxes, share-based compensation — and Molina generated about $754 million of cash before any working-capital movement. The entire swing to a $535 million outflow came from a roughly $1.29 billion working-capital drain, concentrated in two lines: a $591 million reduction in amounts due government agencies (settling prior-period Medicaid risk-corridor and minimum-MLR balances the company had accrued) and a $201 million income-tax payment timing effect [1].
Source: FY2025 Annual Report (Form 10-K), Consolidated Statements of Cash Flows — non-cash add-backs are D&A $195M, deferred taxes $43M, share-based comp $47M, other -$3M [2].
Management's own attribution matches the arithmetic: the year-over-year decline was "driven mainly by Medicaid risk corridor settlement activity, the timing of tax payments, and lower operating performance in the second half of 2025" [3]. Because Molina receives capitation monthly in advance of paying claims, and because state payors can pull premium payments forward or push them back across a period end, the operating cash line is structurally noisier than the earnings it supports [4].
That noise runs both ways, and it is large relative to the business. Over 2020–2025 operating cash flow ranged from a $2.1 billion inflow to the $535 million outflow, while capital expenditure never exceeded $101 million — so free cash flow tracks operating cash almost one-for-one, and the volatility is working capital, not investment.
Source: reported financials, FY2020–FY2025 10-Ks; FY2025 figures per Consolidated Statements of Cash Flows [5].
The honest read cuts both ways. Cumulatively the cash is there: over the six years Molina converted $4.87 billion of net income into $6.56 billion of operating cash — a 1.35× conversion rate that is high, not low, and consistent with a business that collects premium before it pays claims.
6yr Cumulative OCF ($M)
6yr Cumulative Net Income ($M)
OCF / Net Income
Source: derived from reported operating cash flow and net income, FY2020–FY2025 10-Ks [6].
But cumulative conversion is not consistency. For an investor whose framework rewards non-wavering operating cash, the relevant fact is that the annual figure has now printed below net income in three of the last four years — 2022, 2024, and 2025 — as the government-receivable settlement cycle has grown with the premium base. The defensible claim is that Molina's mid-cycle cash generation is real and roughly matches earnings; the claim the record does not support is that it arrives smoothly.
Where the cash actually sits
The balance sheet shows about $8.6 billion of cash and investments against $3.77 billion of long-term debt — a headline that reads like net cash [7]. The net-cash reading breaks once you look at where the cash sits. Most of the cash lives inside regulated health-plan subsidiaries, where roughly $3.1 billion is the statutory minimum capital and surplus those subsidiaries must hold, and where the balance can only move to the parent as a state-approved dividend [8]. The debt sits entirely at the unregulated parent [9].
At the parent itself, cash and investments were $223 million at year-end 2025, down from $445 million a year earlier, and they touched approximately $108 million at the end of the third quarter before recovering [10][11].
Source: FY2025 Annual Report (Form 10-K), MD&A — Financial Condition and Liquidity; statutory minimum is an estimate disclosed by the company [12][13].
The thin parent balance is not the same as a starved parent. The subsidiaries paid $985 million of dividends up to the parent in 2025, after $997 million in 2024 and $705 million in 2023 — a rising, reliable stream of excess statutory capital [14]. The parent's cash cushion thinned not because dividends dried up but because management deployed them: it contributed $439 million back to the subsidiaries for statutory capital, funded the $350 million ConnectiCare acquisition, and repurchased $1.0 billion of stock, part-funded by $838 million of net proceeds from new notes [15][16]. For a reader who treats a net-cash balance sheet as a virtue, the correct adjustment is to ignore the $8.6 billion headline and read the parent on its own: roughly $3.5 billion of net debt at the entity that actually owns the stock, serviced by about $1 billion a year of subsidiary dividends.
Deferred revenue, receivables, and claims payable
Three of the reader's specific balance-sheet tests resolve cleanly, and none flags a warning.
Deferred revenue is negligible and is not debt. Molina carries a deferred revenue line of just $66 million, against $43.1 billion of premium — about half a day of revenue [17]. It is far below the 30-day threshold that would make it a growth signal, and it is immaterial to any net-debt calculation; treating it as debt would move the figure by a rounding error. The company's own economics run the other way — it is paid in advance, so its large current liabilities are claims reserves and government payables, not customer prepayments.
Days in claims payable are stable; the large current liability fell. The medical claims and benefits payable reserve — the insurer's equivalent of inventory — stood at $4,887 million, equal to 47 days in claims payable at year-end, against 48 days a year earlier and 43–46 days through 2025 [18][19]. A stable-to-lower reserve day-count while medical costs were rising is the opposite of the reserve build that would flatter a loss; it argues the 2025 margin break was recognized, not deferred. The other large current liability, amounts due government agencies, actually fell $548 million to $1,326 million as prior-period corridors settled — the balance-sheet mirror of the cash outflow above, and a decline in a payable rather than the suspicious rise the reader watches for [20].
Receivables grew slower than revenue. Receivables rose 7% to $3,533 million while total revenue rose 12%, so days sales outstanding edged down to roughly 30 days of premium — no receivables build masking weak collections [21].
The debt: long-dated and fixed, with one covenant they had to move
The capital structure is conservative and gives the reader little to worry about on refinancing. All $3.8 billion of principal is senior unsecured notes at the parent, fixed-rate, with a weighted-average coupon near 5% and no maturity before 2028. At year-end nothing was drawn on the $1.25 billion revolver or the term loans — in November 2025 the company termed out its floating-rate term-loan borrowings by issuing $850 million of 6.500% notes due 2031, leaving no near-term floating-rate exposure [22].
Source: FY2025 Annual Report (Form 10-K), Note 11 — Debt, contractual maturities table; nothing matures in 2026, 2027, or 2029 [23].
The debt bears on the margin story mainly through its cost. Interest expense rose to $192 million in 2025 from $118 million, as the company borrowed to fund buybacks and acquisitions and refinanced into higher-coupon notes [24]. Against collapsing operating income, EBIT interest coverage fell from about 14× in 2024 to about 4× in 2025 [25]. Four times still clears the credit agreement's 3.0× minimum on a full-year basis — yet on February 4, 2026 the company amended that agreement to temporarily cut the minimum interest-coverage covenant to 1.75× for all of 2026, stepping back up to 2.00×, 2.50×, and 2.75× through 2027 [26].
Covenant relief is not what a company negotiates for a single soft quarter. Cutting the interest-coverage floor to 1.75× for a full year signals that management is planning for 2026 coverage well below the 3.0× it normally maintains — a quieter, more concrete admission than the "trough year" language in the earnings script.
That amendment is the sharpest balance-sheet counterweight to the "temporary dislocation" framing carried into this report by Business and Thesis. It does not prove the margin break is permanent — a 2026 trough with rate restoration in 2027 fits both the covenant step-up schedule and management's account. But it is a dated, filed action that presumes the pressure lasts into 2027, not a quarter.
What the cash says, and what would change the read
The cash-generation engine is intact on a multi-year basis and the balance sheet is financed conservatively: mid-cycle operating cash roughly matches earnings, capital intensity is trivial, the debt is long-dated and fixed, and the parent is fed by about $1 billion a year of subsidiary dividends. On the reader's own scorecard, two things fail. First, operating cash is not consistent — it has wavered below net income in three of the last four years and turned negative in 2025 — so the "non-wavering FCF" test is not met on the reported record, however sound the cumulative figure. Second, the net-cash impression from the consolidated balance sheet is an artifact of regulated-subsidiary reserves; the parent that owns the equity carries roughly $3.5 billion of net debt. Two developments would move the read: operating cash returning to positive in 2026 as the government-payable settlements stabilize, and interest coverage climbing back toward the 3.0× the company felt it had to suspend. Both are checkable in the 2026 filings against the exact lines cited here.
Whether that mid-cycle cash is enough — the reader's 8%-plus free-cash-flow-yield bar, and what today's depressed price pays for a normalized figure — is a valuation question this chapter leaves open.
Return on Capital
Judged by the reader's filter — a durable moat and strong ten-year cash flows — Molina does not clear it: its revenue is rebid and its 2025 free cash flow was negative. This chapter looks at the company on the terms that filter sets aside. On them Molina is a capital-light, high-return reinvestment machine: mid-20s-percent return on equity on almost no capital through 2024. That capital efficiency is real — and earned without a moat, which 2025 shows unwinds fast.
What the screen sets aside
Two prior chapters have already settled how Molina scores against this reader's core tests. It has no customer lock-in — Medicaid revenue is awarded by competitive bid on three-to-five-year cycles and can be rebid away (Revenue Durability). And its cash flow does not stand still: operating cash flow was negative $535 million in 2025 and free cash flow was negative $636 million, so the free-cash-flow-yield screen fails outright (Cash and Capital). A durable-moat, strong-and-steady-cash investor stops reading here.
That stopping point is itself a choice about what kind of business to own. The moat-and-cash filter is built to find companies whose returns are protected by a structural advantage and harvested as distributable cash. It is not built to see a different archetype: the capital-light operator that earns very high returns on a thin sliver of equity and turns those returns back into more business rather than into a dividend. Molina is that second kind of company. Evaluating it on its own economics — as if the moat-and-cash preference were not held — is the purpose of this chapter.
A high return on very little capital
The pattern is clearest in return on equity. From 2019 through 2024, it ran between 25% and 38%, and it did so while the company spent almost nothing on physical capital — capital expenditure has held around a quarter of one percent of revenue for years.
Source: derived from reported financials, FY2019–FY2025 10-Ks; FY2025 results per the FY2025 Annual Report (Form 10-K) [1].
Return on Equity FY2024
Return on Equity FY2025
Capex / Revenue FY2025
Sources: FY2024/FY2025 ROE derived from reported financials; capex intensity from the FY2025 Annual Report (Form 10-K), Consolidated Statements of Cash Flows [2].
The reason so little capital produces so much return is structural to health insurance. Molina collects premium in advance and pays medical claims in arrears; the medical claims payable and the amounts owed to states sit on the balance sheet as float, funding the assets in place of shareholder capital. Equity is therefore small relative to the business it supports — the company runs roughly $45 billion of revenue on about $4 billion of equity [3]. A modest margin on that throughput, geared by the float, lands as a high return on equity. This is a genuine form of capital efficiency, and it is the quality a pure cash-yield screen does not price.
The corollary is that Molina compounds by reinvestment, not distribution. It pays no common dividend; retained earnings and the float have carried book value from about $2.0 billion in 2019 to $4.5 billion in 2024, before the 2025 combination of lower profit and continued buybacks pulled it back to $4.1 billion.
Source: derived from reported financials, FY2019–FY2025 10-Ks; FY2025 equity per the FY2025 Annual Report (Form 10-K) [4].
Where the equity is not paid out or bought back, it is redeployed the way the business grows — into the statutory capital that new premium requires, and into acquisitions and contract wins. In 2025 alone the company reported over $9 billion of incremental annual Medicaid premium from new RFP wins, a sole-source Florida contract worth roughly $6 billion in annual premium, and the closed ConnectiCare acquisition [5]. The negative free cash flow that fails the reader's screen is, in part, this reinvestment: writing more premium obliges the company to hold more statutory capital in its regulated subsidiaries, and management has committed to funding that capital as needed [6]. Cash consumed to grow a high-return book is a different thing from cash lost.
Where the return comes from
Breaking the return into its parts shows both the strength and the fault line. Return on equity is the product of net margin, asset turnover, and balance-sheet leverage. For Molina the leverage and turnover terms are stable; the return moves almost entirely with the margin.
Source: derived from reported financials, FY2021–FY2025 10-Ks (net margin = net income / total revenue; turnover = revenue / total assets; multiplier = total assets / equity) [7].
Turnover held near 2.3–2.9 times and the equity multiplier near 3.5–4.6 times across all five years. The 2025 halving of return on equity — from 26.2% to 11.6% — came almost entirely from net margin falling from 2.9% to 1.0%, as the consolidated medical care ratio moved from 89.1% to 91.7% (Margin Reset). The return is set by a spread of one to three cents on the premium dollar, and that spread is what broke.
The advantage that produces the spread is not a moat but a cost position. Molina has described itself since its 2003 IPO as a low-cost operator — the prospectus claimed its "administrative efficiency is among the best in our industry" [8] — and it still frames its vision as distinguishing itself as "the low-cost, most effective and reliable health plan" [9], built on a singular focus on government programs that lets it "identify and implement efficiencies" [10]. The 2025 general-and-administrative expense ratio of 6.6%, down from 6.7%, is the visible edge of that discipline [11]. A low cost of administering each premium dollar is what lets a bidder win state contracts and still clear its return threshold — an operational advantage that stands in for the structural one the reader looks for.
Why the screen is not merely fussy
Looked at fairly, the same evidence explains why the moat requirement is not idle caution in this case. Three features cut against treating Molina as a durable compounder.
First, a return earned without a moat is a return the system can reclaim. Molina's rates are not set by the company; states and CMS set capitation rates that regulators require to be "actuarially sound," with the plan bearing the risk and left to advocate for adequacy [12]. A payer that sets prices to be adequate — not generous — for the incumbent is a mechanism for competing excess returns away over time. The high historical return on equity is what such a system permits when costs run below the rate assumption; it is not a right.
Second, the cost advantage is conditional on scale and reverses when volume falls. The company's own risk disclosure is explicit: a loss of members brings not just lower dollar margins but lower percentage margins, through "loss of cost efficiency or cost leverage, and the resulting stranded administrative costs" [13]. Operating leverage that flatters returns on the way up works in reverse on the way down — and 2026 premium is guided to fall for the first time in years (Revenue Durability).
Third, the reinvestment is only as good as the returns it earns, and those returns are now visibly lower. Redeploying capital at a 26% return on equity compounds value quickly; redeploying it at 2025's 11.6% does not, and the company chose to return $1 billion through buybacks in each of 2024 and 2025 rather than fund still more growth (Cash and Capital). The float that finances the model also traps it: statutory rules limit how much of the subsidiaries' earnings can ever reach the parent to pay stockholders [14].
A calibrated read
The deprioritized angle earns its hearing. Molina is a real capital-light compounder — high returns on a thin equity base, near-zero capital intensity, value created by reinvestment and buybacks rather than a coupon. Judging it on free-cash-flow yield alone understates a business whose negative cash flow is, in material part, the cost of holding statutory capital against a growing, high-return book. An investor who did not require a moat could reasonably own the compounding.
The same look, though, supports the core of the reader's caution rather than dissolving it. The returns are earned without protection, so the rate-setting mechanism and periodic rebids can reclaim them; the cost edge depends on scale that is now contracting; and 2025 is the live demonstration — a 260-basis-point move in the medical care ratio cut return on equity by more than half in a single year. That fragility is exactly what a durable-moat, steady-cash filter is designed to avoid.
What would tilt the read toward the compounder case: return on equity re-normalizing toward the low-20s as the spread recovers, on the roughly 2–3% pre-tax margin management now targets, with the ratio's stability restored across quarters. What would vindicate the screen: return on equity settling near 2025's low-teens level and staying there, confirming that a rate-taker's returns, however high in good years, are not the durable cash-generative kind — in which case a filter that passed on Molina will have been right to.
Valuation and Buybacks
At $224.82 (July 16, 2026) Molina is a roughly $11.5 billion equity on about 51 million shares, priced against a recovery it has targeted but not yet delivered rather than against what it earns today [1]. At $224.82 the market pays about 9x Molina's 2029 target of $25 adjusted EPS (versus about 20x its 2025 adjusted earnings), so the buyer is underwriting the earnings recovery — yet Molina's own compensation committee forfeited the 2023 three-year performance units on cumulative adjusted EPS of $54.56 against a $59.36 threshold, marked the 2024 and 2025 units to zero as 'not probable,' and judged the FY2027 special-grant threshold of $32 adjusted EPS 'extremely unlikely' — a candid internal view that the multi-year recovery embedded in the price is unlikely to clear even threshold levels through 2027. [2] [3] [4] [5]
The cross-check is worth stating in numbers. The 9x rests entirely on the 2029 $25 target; the company's own FY2027 special-grant threshold of $32 adjusted EPS — set above that $25 [6] — is 'extremely unlikely' on the compensation committee's current view [7], so its internal probability-weighting doubts the very recovery the price underwrites through 2027. The strongest fact the other way sits in the same place: $25 is only about a 2% compound annual rate above the $22.65 the company earned in 2024 [8], a target with a track record behind it, and first-quarter 2026 consolidated MCR of 91.1% printed below the guided path [9].
Share Price (Jul 16 2026)
Market Cap ($M)
P/E on 2025 Adj. EPS
Price / Tangible Book
Sources: price per market data as reported; shares outstanding of 51 million and stockholders' equity from the FY2025 10-K balance sheet [10]; adjusted EPS of $11.03 from the Q4/FY2025 earnings release [11].
This chapter takes the durable-but-rebid top line (Revenue Durability) and the re-based margin (Margin Reset) as given, and asks what the current price pays for them, whether the cash returns are being spent well, and whether the 2024–2026 selloff cut the price by more than it cut the value.
What the price pays for
Molina has no single "right" earnings number right now, because 2026 is a guided trough and 2029 is a management target. The honest approach is to price the stock against each rung of that ladder and let the reader see the spread. On the near rungs it is expensive; on the far rung it is cheap; the gap between the near and far rungs is the recovery being priced.
Sources: 2026 guide of at least $5.00 adjusted EPS [12]; 2027 consensus per analyst estimates as reported; 2025 actual adjusted EPS [13]; 2029 target of $25 adjusted EPS [14]; normalized figure derived below.
The "normalized on today's revenue" rung is the one the reader most needs and the one no feed supplies, so it is built explicitly. Take 2025's premium and total revenue as the base, apply management's own re-based long-term adjusted pre-tax margin of 2–3% (midpoint 2.5%) rather than the 4–5% it targeted before 2025 [15], tax it at the recent ~24% rate, and divide by 51 million shares. That yields roughly $16.80 of adjusted EPS on today's book of business — about a $16–18 range across the 2–3% margin band — or about 13x. That is the multiple on flat earnings at the stated normal margin — Molina neither shrinking nor growing. Everything below that P/E (toward the 9x on $25) requires the premium base to compound from about $43 billion toward the $64 billion the company targets for 2029 [16]; everything above it (toward the 20–44x on 2025–2026) is the multiple carried while the rate-versus-trend gap (Margin Reset) is still open.
On management's own 2–3% pre-tax margin, today's revenue supports roughly $16.80 of adjusted EPS — about 13x at $224.82, the multiple that sits between the ~44x the guided 2026 trough implies and the 9x on the 2029 target.
The free-cash-flow screen it does not clear
For a reader whose first filter is a consistent 8–10% free-cash-flow yield, Molina fails the filter on the record, and the reason matters more than the fact. Reported operating cash flow was negative $535 million in 2025 and free cash flow negative $636 million; the Cash and Capital chapter traced that to the timing of government receivables and payables rather than to capital spending, which never exceeds about $101 million a year. But the reader's stated aversion is precisely to wavering cash flow, and Molina's has wavered from a $2.1 billion inflow (2021) to a $535 million outflow (2025).
Source: free cash flow (operating cash flow less capital expenditure) from FY2021–FY2025 cash-flow statements, as reported, divided by the current ~$11.5 billion market capitalization; illustrative, since each year's cash was earned on a different share count and market value. [17]
Measured against today's market value, Molina's own cash generation has swung from an 18% yield to a negative one inside five years. The reader's 8–10% bar is cleared comfortably in the strong years and missed entirely in 2025. A cross-cycle proxy is kinder but still not decisive: on the normalized ~$16.80 of earnings derived above — and with capex trivial and mid-cycle cash conversion running near one times net income over 2020–2025 (Cash and Capital) — a mid-cycle free-cash-flow yield lands around 7–8%, at the low edge of the reader's range rather than through it. The honest statement is that Molina meets the FCF-yield screen only on a normalized basis it has not yet demonstrated, and its cash flow has the volatility the reader explicitly dislikes.
No asset floor beneath the price
Tangible book value is thin, so the reader looking for a balance-sheet backstop will not find one here. Stockholders' equity of $4,069 million carries $1,958 million of goodwill and $237 million of other intangibles, leaving about $1,874 million of tangible equity, or roughly $36.75 per share [18]. At $224.82 the stock trades at about 6.1x tangible book.
Total Equity ($M)
Goodwill ($M)
Other Intangibles ($M)
Tangible Equity ($M)
Source: FY2025 10-K — stockholders' equity from the Consolidated Balance Sheets [19]; goodwill of $1,958M and intangibles of $237M per the impairment risk factor [20].
A 6x multiple of tangible book is not, by itself, a warning: Molina is a capital-light services business that earned a 26% return on equity as recently as 2024, and such a business should trade well above the accounting value of its net assets. But it means the price rests entirely on the earnings stream and the state contracts behind it, not on any liquidation value. For context, the tangible equity is smaller than the roughly $3.1 billion of statutory minimum capital locked inside the regulated subsidiaries (Cash and Capital) — the tangible net worth attributable to shareholders is modest relative to the balance sheet the business runs on.
The same caution applies to the EV/EBITDA lens the reader uses as an alternative gate. On the parent-net-debt framing that the cash chapter established as the honest one — about $3.5 billion of net debt at the entity that owns the equity — enterprise value is roughly $15 billion.
Source: EBITDA derived as operating income plus depreciation and amortization from the FY2024–FY2025 filings; enterprise value of ~$15.2B = ~$11.5B market cap plus ~$3.5B parent-level net debt (per Cash and Capital) plus finance leases. [21]
On depressed 2025 EBITDA the stock is about 15.6x — above the reader's sub-12 gate; on pre-break 2024 EBITDA it is about 8x — through it. As with the P/E ladder, the multiple clears the bar only if profitability normalizes. (EV/EBITDA is in any case an awkward lens for a health plan, where regulated cash sits against reserves and the industry prices itself on adjusted EPS and the medical care ratio; the consolidated net-cash framing would flatter these numbers to 3–7x, which is why the parent-net-debt view is the one that should govern.)
Buybacks: real, large, and imperfectly timed
The reader treats buybacks as a test of whether management exploits a depressed price. Molina passes on scale and fails on timing. It has no dividend, and it returned $1.0 billion in each of 2024 and 2025 entirely through repurchases, taking the diluted share count from about 58 million, where it had sat for years, down toward 51 million.
Source: weighted diluted share counts from FY2019–FY2025 income statements and the Q1 2026 10-Q, as reported. [22]
The timing, however, is a genuine mark against management's capital discipline, and it is worth stating precisely rather than glossing. Of the $1.0 billion spent in 2025, half went out in the first quarter — about 1,679,000 shares at an average cost of $297.83 — exhausting the October 2024 authorization just before the stock collapsed. The second $500 million was spent in the third quarter at an average of $175.50, into the weakness [23]. The shares bought at $298 were underwater within months, as the stock reached $122.65 in February 2026.
Sources: Q1 2025 repurchase of ~1.68M shares at $297.83 and Q3 2025 repurchase of ~2.85M shares at $175.50 per Note 13 [24]; low and current prices per market data as reported.
So the record is mixed rather than exemplary: management did shrink the count by roughly a tenth in eighteen months, but it spent its first tranche near the peak and only its second into the fear. Two constraints bear on what comes next. About $500 million remained under the April 2025 authorization as of February 10, 2026, running through the end of 2026 [25]. But the parent holds only about $205 million of cash [26], so further repurchases depend on the ~$1 billion a year the subsidiaries can upstream — the same dividend capacity the cash chapter identified. At today's price, completing the remaining $500 million would retire only about another 2 million shares.
The selloff and the value behind it
The reader hunts for names where a fear-driven selloff takes more off the market cap than off the net present value of the cash flows. Molina fits the shape of that setup; whether it fits the substance is what the earlier chapters weigh.
The market-cap move is not in doubt. From a March 2024 peak near $419 on about 58 million shares — roughly $24 billion — the equity fell to about $6.3 billion at the February 2026 low, an ~$18 billion, ~74% drawdown, before recovering to about $11.5 billion. Against that, management's stated earnings target barely moved: the 2029 adjusted EPS goal is $25 [27], essentially the $22.65 the company earned in 2024. If that target is credible, the value fell far less than the price, and the recovery still has room — the bull's core claim.
The bear's answer is the substance the price move may be right about. The Margin Reset chapter found the profitability re-basing to be largely structural: management itself cut its long-term pre-tax margin target from 4–5% to 2–3% and lifted its medical-care-ratio target by roughly 350 basis points. A business earning half its former margin per premium dollar, whose revenue is competitively rebid rather than owned (Revenue Durability), and whose cash flow wavers, deserves a lower multiple than it once carried — so part of the $18 billion is a re-rating that should not reverse, not an overshoot that should. And the $25 target is not this year's earnings; it needs the premium base to compound about 15% a year to $64 billion while the margin holds, which the same chapters show is exposed to policy and rate-setting the company does not control.
At $224.82 the stock sits between these readings, not at either. It is roughly 13x a normalized result on today's revenue and 9x the 2029 target — pricing neither a permanent impairment (which 13x on flat earnings would not be) nor the full realization of $25 (which would leave far more than 9x on the table). What would move the read is checkable and dated: 2026–2027 Medicaid rate updates that narrow the rate-versus-trend gap would validate the recovery rungs of the ladder; another year of negative or soft operating cash flow, or a lost Washington reprocurement, would push the fair multiple back toward the normalized-today floor and leave the reader's FCF-yield screen unmet.
Ownership and Options
Molina passes the tradability test a value buyer applies before anything else: the NYSE-listed shares trade roughly $240 million a day, and listed options run out to January 2028, giving a defined-risk way to hold the recovery for more than a year. The cost of that access is high. Implied volatility sits near 50% — about double a stable insurer's — so that optionality is expensive, and the people best placed to signal conviction are quiet: no insider has bought in the open market since 2018, the buyback paused, and the average sell-side target is below the price.
The equity: liquid, ownable, and a weak long-run hold
Share Price (Jul 16 2026)
52-Week Low
52-Week High
Avg Daily Volume ($M, 20d)
Source: 52-week levels and average daily volume derived from daily price data through Jul 16 2026; NYSE listing per FY2025 Annual Report (Form 10-K), Item 5 [1].
Liquidity is not a constraint here. The stock turns over about 700% of its float a year, roughly $240 million changes hands on an average day — near 2% of market value — and a position worth 1% of the company (about $126 million) could be exited in three to six days at a fifth of daily volume. A value investor can build or unwind a meaningful stake without moving the price. The shares list on the New York Stock Exchange as "MOH", there are 14 registered holders of record, and the company has never paid a cash dividend [2] — total return is entirely price and buybacks, with no coupon to wait in.
That return has been poor over the cycle. $100 invested in Molina at the end of 2020 was worth $80 at the end of 2025; the same $100 in the S&P 500 grew to $195, and in the company's own peer group to $160 [3].
Source: FY2025 Annual Report (Form 10-K), Stock Performance Graph, five-year cumulative total return [4].
The line tells the two-act story the rest of this report dissects: a top-decile compounder into 2023, then a round-trip that gave back five years of relative performance in the 2024–2025 margin break. By that arithmetic the shares have already fallen — $100 invested at end-2020 was worth $80 at end-2025 — rather than sitting at a demanding valuation.
Options: the universe gate clears, but volatility is richly priced
Molina carries a full listed-options market, and the longest-dated contracts extend to January 15, 2027 and January 21, 2028 — the latter roughly eighteen months out. Long-dated, at-the-money options beyond one year exist, so the position can be expressed with defined downside rather than only in the common. On availability, the name fits a mandate that requires liquid, long-dated optionality.
The price of that optionality is high. Molina's shares have realized about 42% annualized volatility over the past month, and the term structure of implied volatility sits above even that: roughly 53% at the four-month tenor and in the mid-60s for the nearest expiry, the latter lifted by second-quarter results due in late July.
Source: realized 30-day volatility derived from daily price data; historical and implied volatility per third-party options data (AlphaQuery), as of Jul 16 2026.
A stable managed-care name would typically carry implied volatility in the 25–30% range; Molina's is close to double that. The options market is pricing continued large moves — the same unresolved question the margin work leaves open (Margin Reset): whether 2025 was a step-change or a dislocation. For the buyer, that means a January 2028 call to hold the recovery is available and defined-risk, but the premium embeds roughly 50% annualized volatility, so a large move in the stock is needed just to clear the cost of carry. The optionality is a genuine tool, not a cheap one.
One caveat on precision: exact at-the-money open interest and bid-ask spreads for each expiry require a live options terminal and are not in the source record. The read on tradability rests on the depth of the underlying — a stock trading $240 million a day almost always supports liquid at-the-money strikes — and on the confirmed presence of the 2027 and 2028 expirations. Reported options positioning is not one-sided: the put-to-call ratio on open interest is about 0.65, so the book is not heavily skewed toward downside protection.
Who is buying — and who is not
For a reader who treats management's own money and the buyback as conviction signals, Molina offers little confirmation at the lows.
Insiders have not bought a share in the open market since 2018. Through the entire 2024–2025 drawdown — including the trade to a 52-week low of $122.65 — Form 4 filings show grants, tax-withholding, and option mechanics, but no discretionary open-market purchases, and only about $3.5 million of open-market selling in 2025–2026. There was no insider capitulation, but there was also no one stepping in to buy the collapse.
The buyback tells a sharper version of the same story. Molina returned $1.0 billion through repurchases in each of 2024 and 2025, but in the fourth quarter of 2025 — with the stock trading between roughly $145 and $193 — it made no repurchases under its program, withholding only 1,300 shares to settle employee tax obligations [5]. The company did not lean into the weakest prices of the year, consistent with the parent-cash constraint detailed in Valuation and Buybacks rather than with opportunistic buying.
Watch item: a resumption of repurchases into weakness — capacity permitting, as detailed in Valuation and Buybacks — would be the clearest management-conviction signal available.
The sell-side is neutral to cool. Of 19 analysts, 3 rate the stock a buy, 15 a hold, and 1 a strong sell; the average price target of $210.76 (median $209) sits about 6% below the $224.82 price, within a wide $129–$286 range.
Source: consensus analyst ratings, as of Jul 2026.
Last Price
Mean Target
High Target
Low Target
Source: consensus price targets (19 analysts), as of Jul 2026.
Underneath the ratings, the estimate revisions match the "priced as a recovery" frame from the valuation work (Valuation and Buybacks): over the past 90 days the Street cut its 2026 EPS estimate from about $5.53 to $5.16 while lifting 2027 from about $5.77 to $8.34. Analysts are marking down the trough year and marking up the rebound — pricing the recovery, not the present. Reported short interest is not available in the source record, so the crowded-short question cannot be answered from what is on file.
What the positioning adds up to
The tradability box is checked: a value investor can own Molina in size and can express the view through January 2028 options with defined risk. What positioning does not offer is a cheap tailwind. Implied volatility near 50% means the option market demands a rich premium for exactly the uncertainty this report has been weighing; insiders are not buying the lows; the buyback stepped aside at the weakest prices; and the median analyst target sits below the last trade. A buyer here is early and largely unaccompanied, underwriting the earnings recovery against a market that is still pricing continued volatility rather than resolution.
Three things would change that read, each checkable: implied volatility compressing back toward the stock's realized level and a normal insurer's 25–30% as margin visibility returns; open-market insider buying or a resumed buyback into weakness; and sell-side targets moving above the price. None has happened yet.
Management and Pay
The team facing Molina's 2025 profit break is led by the executive who pulled the company out of a deeper hole in 2017 — a $9.07-per-share loss that cost the founding family its jobs. That record is real, and the pay program has now gone almost entirely to zero as earnings fell, so the alignment is real too. Two uncertainties remain: whether a rate-and-policy squeeze is the kind of problem a turnaround operator can fix, and whether a retirement-eligible CEO stays for the attempt.
The same operator, a second downturn
Molina has been here before, and worse. In 2017 the company earned a pre-tax loss of $612 million on $19.9 billion of revenue, a medical care ratio of 90.6%, and a net loss of $9.07 per diluted share [1]. On May 2, 2017, the board terminated the company's chief executive and chief financial officer — both members of the founding Molina family — "specifically because of the Company's poor financial performance" [2].
The board hired Joseph Zubretsky as president and CEO in late 2017 [3], a career insurance operator with more than 35 years at firms including Aetna and The Hanover Group [4]. The recovery was fast: 2018 delivered $10.61 per diluted share on $707 million of net income and an 85.9% MCR [5], and by 2019 management could tell shareholders that "margin recovery is complete, margin sustainability is well under way, and the pivot to growth has begun" [6]. Zubretsky, still in the chair at age 69, is credited by the board with leading "the Company in its turnaround and growth plans" [7]. The five-year revenue tripling and record margins the rest of this report weighs were built on his watch.
Sources: 2019 Proxy Statement, 2017–2018 performance [8] [9]; FY2025 Annual Report, Financial Results Summary [10].
The comparison cuts two ways, and the difference in kind matters more than the difference in degree. The 2017 crisis was an outright loss, and the board treated it as a governance failure it could fix by changing the people — expansion into unprofitable markets and cost controls that a new operator could reverse. The 2025 break is milder on the page — a reduced profit of $8.92 per share, not a loss — but its cause sits outside management's direct control: an MCR that rose 260 basis points to 91.7% on higher medical utilization and acuity, on premium rates that states and CMS set (Margin Reset) [11]. A turnaround specialist can close unprofitable plans; he cannot legislate a rate increase. The precedent is genuine evidence this management can execute in a crisis, and an imperfect guide to whether it can fix this one.
Pay that went to zero
The clearest read on how management views its own performance is what its pay program did with it — and for 2023 through 2025, it paid almost nothing. For 2025, because adjusted earnings of $11.03 per diluted share fell below the plan threshold, the committee awarded no short-term cash bonus to any named executive; Zubretsky's $3.2 million target bonus paid $0 [12]. The three-year performance stock units granted in 2023, tied to cumulative 2023–2025 adjusted EPS, needed $59.36 to reach even threshold vesting; actual cumulative EPS came in at $54.56, so the entire tranche — 33,967 target units for the CEO — was forfeited without payment [13]. The 2024 and 2025 PSU grants, whose measurement periods run through 2026 and 2027, are now judged "not probable," and the company marked their fair value to zero at December 31, 2025 [14].
That flows straight through to realized pay. On the SEC's "compensation actually paid" measure — which marks equity to the share price each year — Zubretsky's pay fell from $75.9 million in 2021 to $15.4 million in 2024 and turned negative, minus $15.3 million, in 2025 [15]. The company notes the swing was driven largely by the stock, whose earlier gains reflected both results and an expanding forward multiple [16]. That is the mechanism working as intended: as the shares fell roughly two-thirds from their 2024 peak (Ownership and Options), the CEO's realized compensation went with them.
Source: FY2025 Proxy Statement, Pay Versus Performance; adjusted EPS over the same years ran $13.54, $17.92, $20.88, $22.65, then $11.03 [17].
The gap between granted and realized pay for 2025 is stark. Zubretsky's summary-table total was $18.3 million, of which $16.2 million was the grant-date value of stock awards; measured at the value those awards actually held on December 31, 2025 — with the PSUs at zero and only time-vested restricted shares retaining value — his total was $6.0 million [18]. The company underlined the point with its own supplemental pay ratio: 228-to-1 as granted, but 107-to-1 once the zeroed 2025 PSUs are excluded [19].
2025 CEO Pay, As Granted ($M)
Marked to Year-End ($M)
Cash Bonus Paid ($M)
Source: FY2025 Proxy Statement, Summary Compensation Table (grant-date total $18.3M; value at 12/31/2025 $6.0M) and short-term bonus ($0 of a $3.2M target) [20] [21].
Two footnotes on this record are worth holding. First, a one-time special retention grant made to Zubretsky in the fall of 2024 was 100% performance-based, vesting only if adjusted EPS in fiscal 2027 reaches $32 at threshold and $36 at target; after the 2025 cost spike the committee now calls achievement "extremely unlikely," leaving the award at $0 value, and it has not modified the terms [22] [23]. That the grant is worthless is a sign of rigor, but the $32–$36 bar was set near the 2024 peak and sits well above management's own $25-by-2029 plan (Valuation and Buybacks) — so its lapse says more about how aggressive the original target was than about the base recovery path.
Watch item: the 2024 special retention grant designed to keep the CEO — who is eligible to retire under his employment agreement — is now expected to vest at $0. The grant was meant to hold him through 2027; on the company's own reckoning it no longer provides that retention economics.
Second, the 2025 say-on-pay vote failed — a sharp break from the prior five years, which averaged over 90% support [24]. The board responded with an outreach program reaching holders of roughly 77% of shares; the principal concern was that same one-time special grant [25]. The episode is a modest governance demerit, but the response — engagement plus disclosure rather than a re-priced award — is consistent with the pay-for-performance stance the zeroed bonuses demonstrate.
Alignment, and where it stops
Zubretsky's incentives point the right way, but his cash conviction has limits. He beneficially owned 373,465 shares as of March 2026 — under 1% of the 52.1 million outstanding, but comfortably above the CEO's stock-ownership requirement of five times base salary [26] [27]. The entire officer-and-director group holds 749,230 shares, or 1.44% of the company [28]. That stake ties management to the outcome, and the forfeited awards mean insiders felt the drawdown. What is absent is fresh conviction: no insider has bought in the open market since 2018, including through the fall to the February 2026 low (Ownership and Options). Alignment here runs through retained and forfeited grants, not through executives adding shares at the bottom.
The board around him is conventional and independent — ten directors, nine of them independent, with an independent chairman and every committee composed exclusively of independent members; Zubretsky is the only insider on the board [29] [30]. This is the same board construct that fired the founders in 2017 and has since backed the current CEO through a full cycle.
What would change the read
The evidence supports a specific, bounded judgment. The management case is a genuine asset: the CEO in the chair engineered a complete recovery from a worse crisis, and a pay program that zeroed out three straight years of incentives is aligned rather than cosmetic. The strongest facts against leaning on it are three. The 2017 hole was a fixable operating failure; the 2025 squeeze runs on rates management does not set, so the prior turnaround is an imperfect template. The clearest alignment signal — near-zero realized pay — is also the company's own admission that even threshold three-year earnings targets are now out of reach. And the retention package built to hold the turnaround architect through 2027 is expected to pay nothing, against a CEO who can retire at will.
The read would strengthen if 2026–2027 results pull the cumulative PSU targets back toward threshold, or if insiders begin buying in the open market — either would convert "aligned by design" into "convinced by choice." It would weaken materially if Zubretsky signals departure, since the retention economics meant to keep him have lapsed and the bench has not been tested in his absence. For now, the people are a reason to take the recovery case seriously, not a reason to assume it.
Bull and Bear
A professional investor coming to Molina today weighs two readings of the same facts. On one side is a mechanical bridge management has drawn from a depressed 2026 base of at least $5.00 in adjusted EPS to a $25.00 target in 2029 — a climb that, by management's own account, "requires only a modest improvement in the Medicaid rate and trend imbalance" [1]. On the other is a structural read: a re-based, policy-exposed managed-care aggregator now targeting a 2–3% pre-tax margin, whose premium base is falling for the first time in years. This chapter puts the two on the same facts and marks what would decide between them.
The catalyst: a bridge that does not need 88% back
The bull case is not a hope that the old economics return. It is arithmetic on the depressed base. Molina's adjusted EPS collapsed from $22.65 in 2024 to $11.03 in 2025, and 2026 is guided to at least $5.00 [2]. Against that trough, management's 2029 target of $25.00 in adjusted EPS is a roughly 70% compound growth rate — but the destination is only modestly above the $22.65 the company actually earned in 2024 [3].
Source: 2026 Investor Day — 2019–2026 actual/guided [4]; 2029 target [5]. 2026 and 2027 are floors (guidance "at least"); 2027 is the initial building-block level, not a point target.
What the bridge rests on matters more than its slope. The clean, near-term rungs are contractual and self-help, not a bet on the medical-cost cycle. Management's 2027 building blocks take the $5.00 base up by $1.50 as the $6 billion Florida CMS contract ramps, $1.00 as it exits the loss-making standalone Medicare Advantage prescription-drug (MAPD) product, and $2.00 from operating leverage — offset by a $1.50 drag from legacy Medicaid MCR and $1.50 of other embedded-earnings timing, for an initial 2027 level near $6.50 before any further rate improvement [6].
Source: 2026 Investor Day, 2027 Adjusted EPS Building Blocks [7].
The 2029 destination adds the slower-burning rungs: premium revenue growing about 15% a year to $64 billion, a pre-tax margin recovering roughly 150 basis points to 2–3%, plus M&A and buybacks [8]. Crucially, the consolidated medical care ratio in the 2029 plan is 91–92% — roughly where it runs today, not the ~88% it averaged for five years before the break [9]. The earnings recovery the bull is buying comes from a bigger book earning a permanently thinner spread, not from the spread returning to its old width — which is why the depressed multiple (Valuation and Buybacks) can rebuild earnings without the margin ever normalizing.
The bear: a thinner, more exposed business deserves a lower multiple
The structural read accepts the same bridge and draws the opposite conclusion. Management itself re-based its long-term margin down — the consolidated MCR target moved from 87.5–88.5% to 91–92%, and the pre-tax margin target from 4–5% to 2–3% (Margin Reset) [10]. A business that keeps two to three cents of pre-tax profit per premium dollar, sources three of every four of those dollars from Medicaid contracts it must periodically re-win, and is exposed to federal funding and eligibility policy more than to any competitor (Revenue Durability) is a different security than the mid-cycle compounder the pre-2025 multiple assumed. On that view, part of the 65% drawdown is a permanent re-rating, not a dislocation waiting to close.
The bear also has a fresh, uncomfortable fact: the top line has turned. Full-year 2026 premium is guided to about $42 billion, and management now expects same-store Medicaid membership to fall 6% this year, ending near 4.5 million members [11]. The government pie can shrink faster than share is won, and the largest policy headwinds — work requirements and funding cuts under the 2025 federal budget law — are scheduled to phase in across 2027–2029 (Revenue Durability), the very years the bridge needs revenue compounding at 15%.
The tension on shared facts
Each row below is a fact both sides accept; what separates bull from bear is the reading, and the last column is the observable that would settle it.
Sources: adjusted-EPS arc and 2029 outlook, 2026 Investor Day [12] [13]; Q1 2026 results and membership, Q1 FY2026 call [14] [15]; positioning per Ownership and Options; valuation per Valuation and Buybacks.
The first data point
The debate is not static. Molina's Q1 2026 — its first quarter reported since the plan was drawn — gave the bull the earliest supporting evidence. Consolidated MCR came in at 91.1% with adjusted EPS of $2.35 and a 1.6% adjusted pre-tax margin; Medicaid ran 92%, Medicare 89.8% [16]. More important than the level was the trend read: management said the post-pandemic acuity shift that drove the 2025 break "was behind us and would not recur is holding up," and reaffirmed a 5% medical-cost-trend assumption for the year [17]. Operating cash flow was positive at $1.1 billion, and several states had already granted off-cycle rate increases that would be upside to guidance [18].
Share Price (Jul 16 2026)
P/E on 2029 Target
Q1 2026 Adj. EPS
Q1 2026 Consolidated MCR
Sources: share price as reported (Jul 16 2026); P/E derived from the $25 target [19]; Q1 2026 EPS and MCR, Q1 FY2026 call [20].
The bear's answer sits in the same transcript. Management called the quarter "solid under the circumstances" but explicitly declined to raise the year, choosing to "merely" reaffirm at least $5.00 and roughly $42 billion of premium, and noting earnings are front-loaded because the January Medicaid rate cycle and the Florida ramp fall unevenly across the year [21]. The embedded-earnings pipeline that anchors 2027 — about $2.50 per share from combined MAPD losses and Florida first-year costs "certain to be positive impacts" next year — is real, but by construction it is a 2027 event, not a 2026 one [22].
What decides it, and where the price sits
The two cases converge on the same set of checkable observables. A reader can track the bridge, quarter by quarter, against these:
Sources: rate/trend and membership items, Q1 FY2026 call [23] [24]; Florida and 2027 bridge, 2026 Investor Day [25]; Washington and policy per Revenue Durability.
The evidence, read together, points to a name that is priced for a partial recovery and has taken its first supportive step toward one. At $224.82 the market pays about 9 times the 2029 target and roughly 13 times a normalized result on today's revenue at the re-based margin — a multiple that already discounts something short of full delivery, so partial success re-rates the stock and outright failure is largely in the price. The bridge's near-term rungs (Florida, the MAPD exit, operating leverage) are contractual and more reliable than its margin-recovery rung, and Q1 2026 is a real, if single, data point that the cost trend has stopped worsening.
The strongest facts against that read are equally concrete and belong in the same breath. Management re-based its own margin targets downward and, given a favorable quarter, chose to reaffirm rather than raise — the behavior of a team that still sees wide outcomes. No insider has bought and no buyback has resumed through the entire drawdown (Ownership and Options), so the people closest to the numbers have not confirmed the recovery with capital. What would move the read: two or three quarters of consolidated MCR below the guided path, joined by off-cycle rate updates, would validate the modest rate improvement the bridge is built on; a lost Washington rebid or OBBBA-driven eligibility cuts would break the top-line leg that the whole $5-to-$25 climb assumes. The watch table above lists the observables that settle the case quarter by quarter; Q1 2026 is the first of them on the table, and it read to the bull side.