Annual Reports
Molina Healthcare, Inc.'s annual reports contain management's most considered account of the business. These are the sections, passages and visual pages worth opening in the originals preserved in Sources.
Molina Healthcare, Inc. — FY2025 Annual Report (Form 10-K) — FY2025
The year the thesis was tested: net income fell to $472M from $1,179M as the medical care ratio jumped to 91.7%; OBBBA reshapes the runway. · Open the full document →
Item 1. Business — Overview — p. 7 · Read the full section →
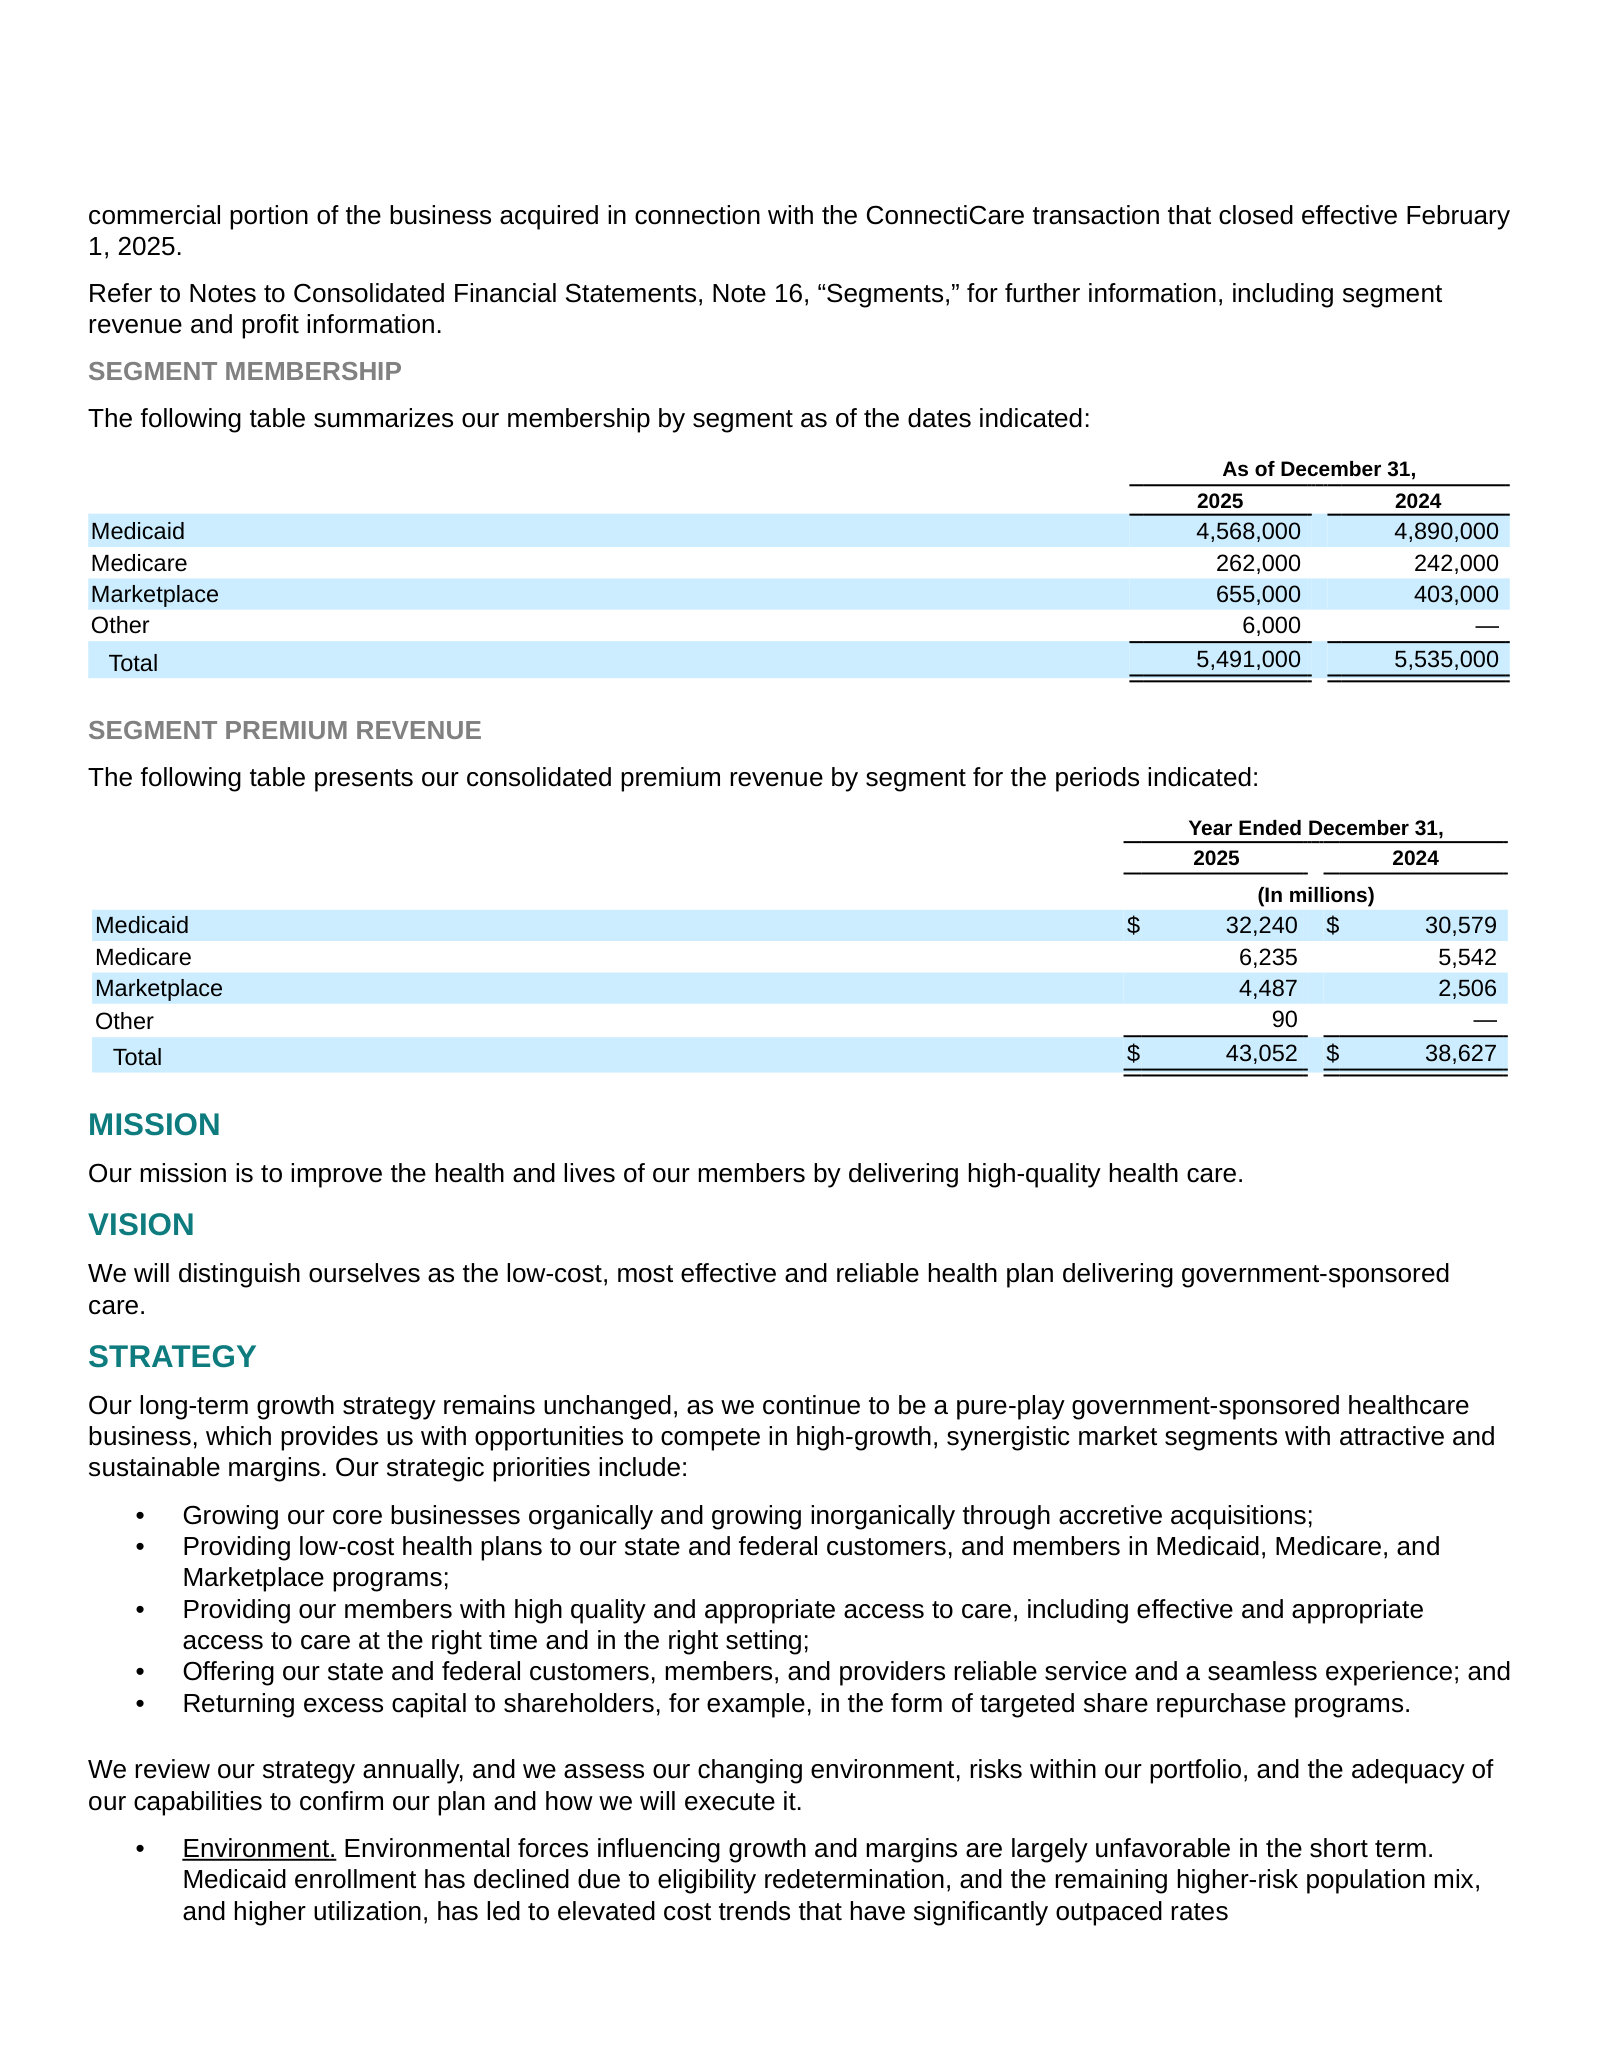
Defines a pure-play government-sponsored insurer: ~5.5M members across 21 states, paid fixed premiums under four segments.
Item 1. Business — Trends and Uncertainties: OBBBA — p. 23 · Read the full section →
Management's own read on the legislative shocks that shrink the runway — Medicaid work rules and expiring Marketplace subsidies.
OBBBA's expected 15–20% cut to 1.2M Expansion members and phased Marketplace eligibility curbs.
The President signed the OBBBA into law in July 2025, which contains changes to the Medicaid and Marketplace programs. […] We currently estimate the reduction in enrollment will be in the range of 15% to 20% by 2029 on 1.2 million members in our Medicaid Expansion population, and any acuity shifts should be modest and gradual. […] The law limits which legal aliens may be eligible for Marketplace PTCs and will require pre-enrollment eligibility verification for enrollees to receive PTCs. These changes are planned to be phased in over the period from 2026 to 2028 and are expected to reduce national Marketplace enrollment as well.
p. 23 · Read in context →
Item 1A. Risk Factors — p. 39 · Read the full section →
The two risks that actually bite a thin-margin capitated insurer: state rates lagging cost trend, and a volatile Marketplace.
Fixed premiums vs rising costs — the core margin risk, already showing up in prior quarters.
Our premium revenues consist of fixed monthly payments per member, and supplemental payments for other services such as maternity deliveries. These premiums are fixed by contract, and we are obligated during the contract periods to provide healthcare services as established by the state governments in which our health plans operate. […] If the premiums paid to us are not increased at a rate that is commensurate with the rate at which medical expenses related to healthcare services rise, or the rate at which health care utilization rates increase, our medical margins will be compressed or eliminated, and our earnings will be negatively affected. We have seen in prior quarters that medical expenses have risen higher than anticipated, and that our capitation rates have not kept pace with the sharp rate of that medical care cost increase.
p. 39 · Read in context →
Margin fragility quantified: one point of MCR would have cut diluted EPS from $8.92 to ~$2.72.
Because the premium payments we receive are generally fixed in advance and we operate with a narrow profit margin, relatively small changes in our medical care ratio can create significant changes in our overall financial results. For example, if our overall medical care ratio of 91.7% for the year ended December 31, 2025, had been one percentage point higher, or 92.7%, our net income per diluted share for the yea ended December 31, 2025 would have been approximately $2.72 rather than our actual net income per diluted share of $8.92, a difference of $6.20.
p. 41 · Read in context →
Item 7. MD&A — Consolidated Results — p. 77 · Read the full section →
Management explains why 2025 earnings halved: MCR rose across every segment while rates lagged.
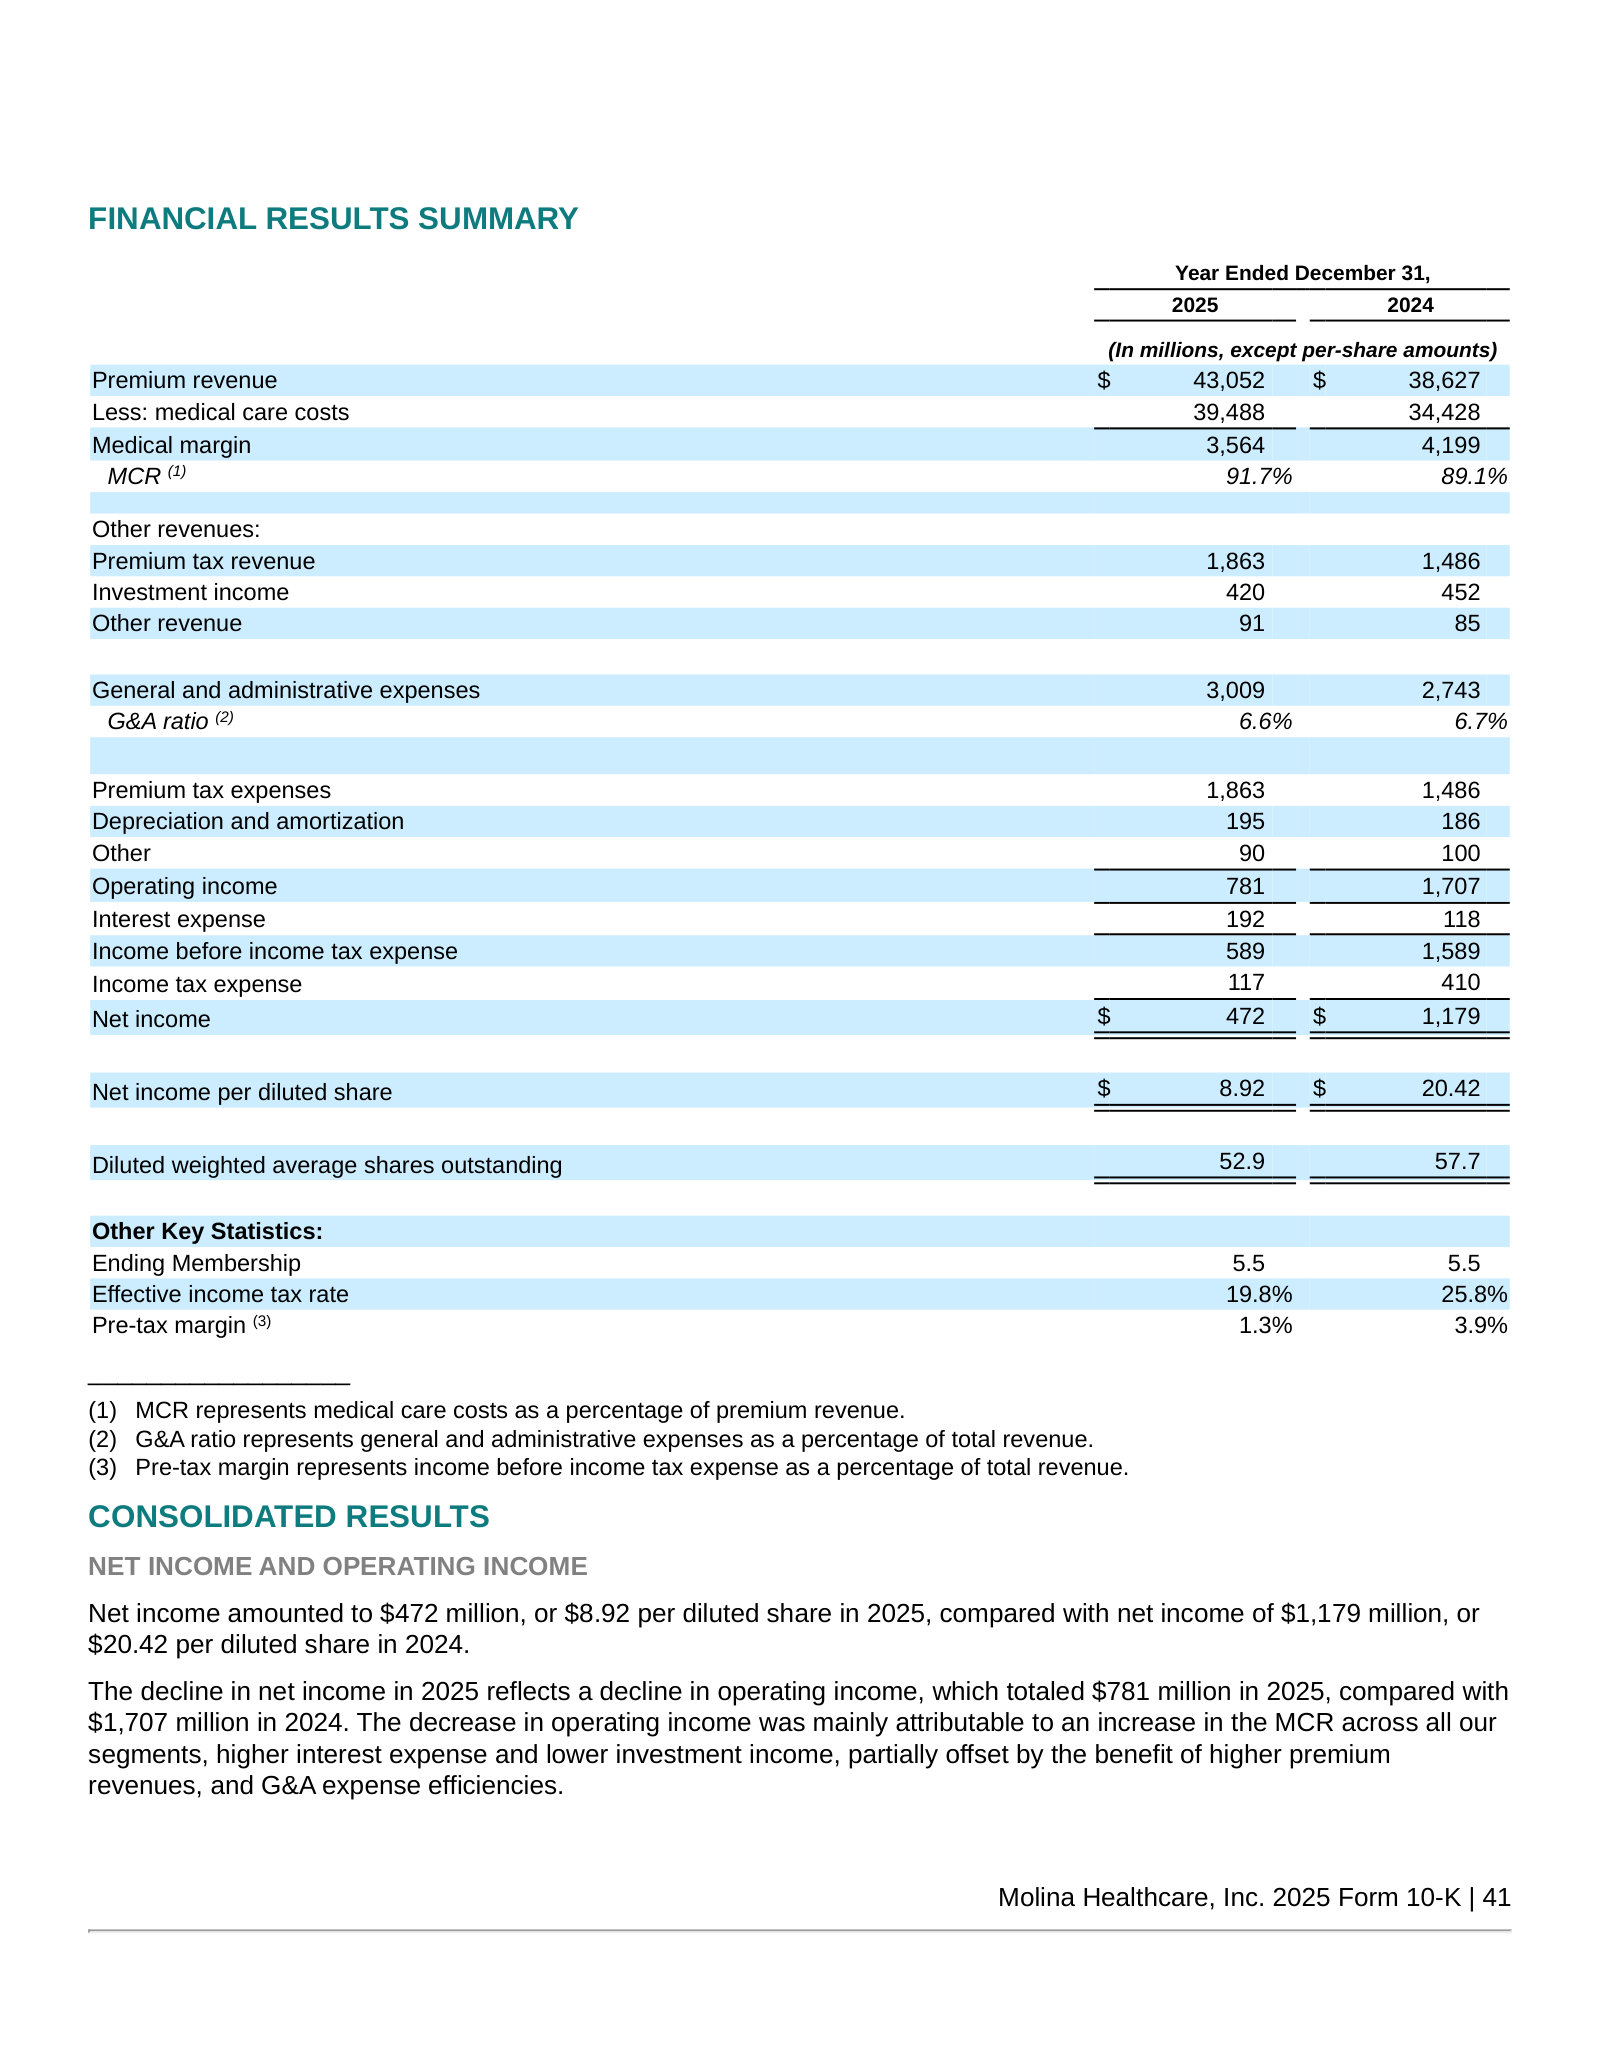
The earnings decline attributed to higher MCR across all segments and interest expense.
The decline in net income in 2025 reflects a decline in operating income, which totaled $781 million in 2025, compared with $1,707 million in 2024. The decrease in operating income was mainly attributable to an increase in the MCR across all our segments, higher interest expense and lower investment income, partially offset by the benefit of higher premium revenues, and G&A expense efficiencies.
p. 78 · Read in context →
Item 7. MD&A — Segment Financial Performance — p. 81 · Read the full section →
Where the margin broke, segment by segment — Medicaid MCR to 91.8% and Marketplace normalizing off a 75.4% base.
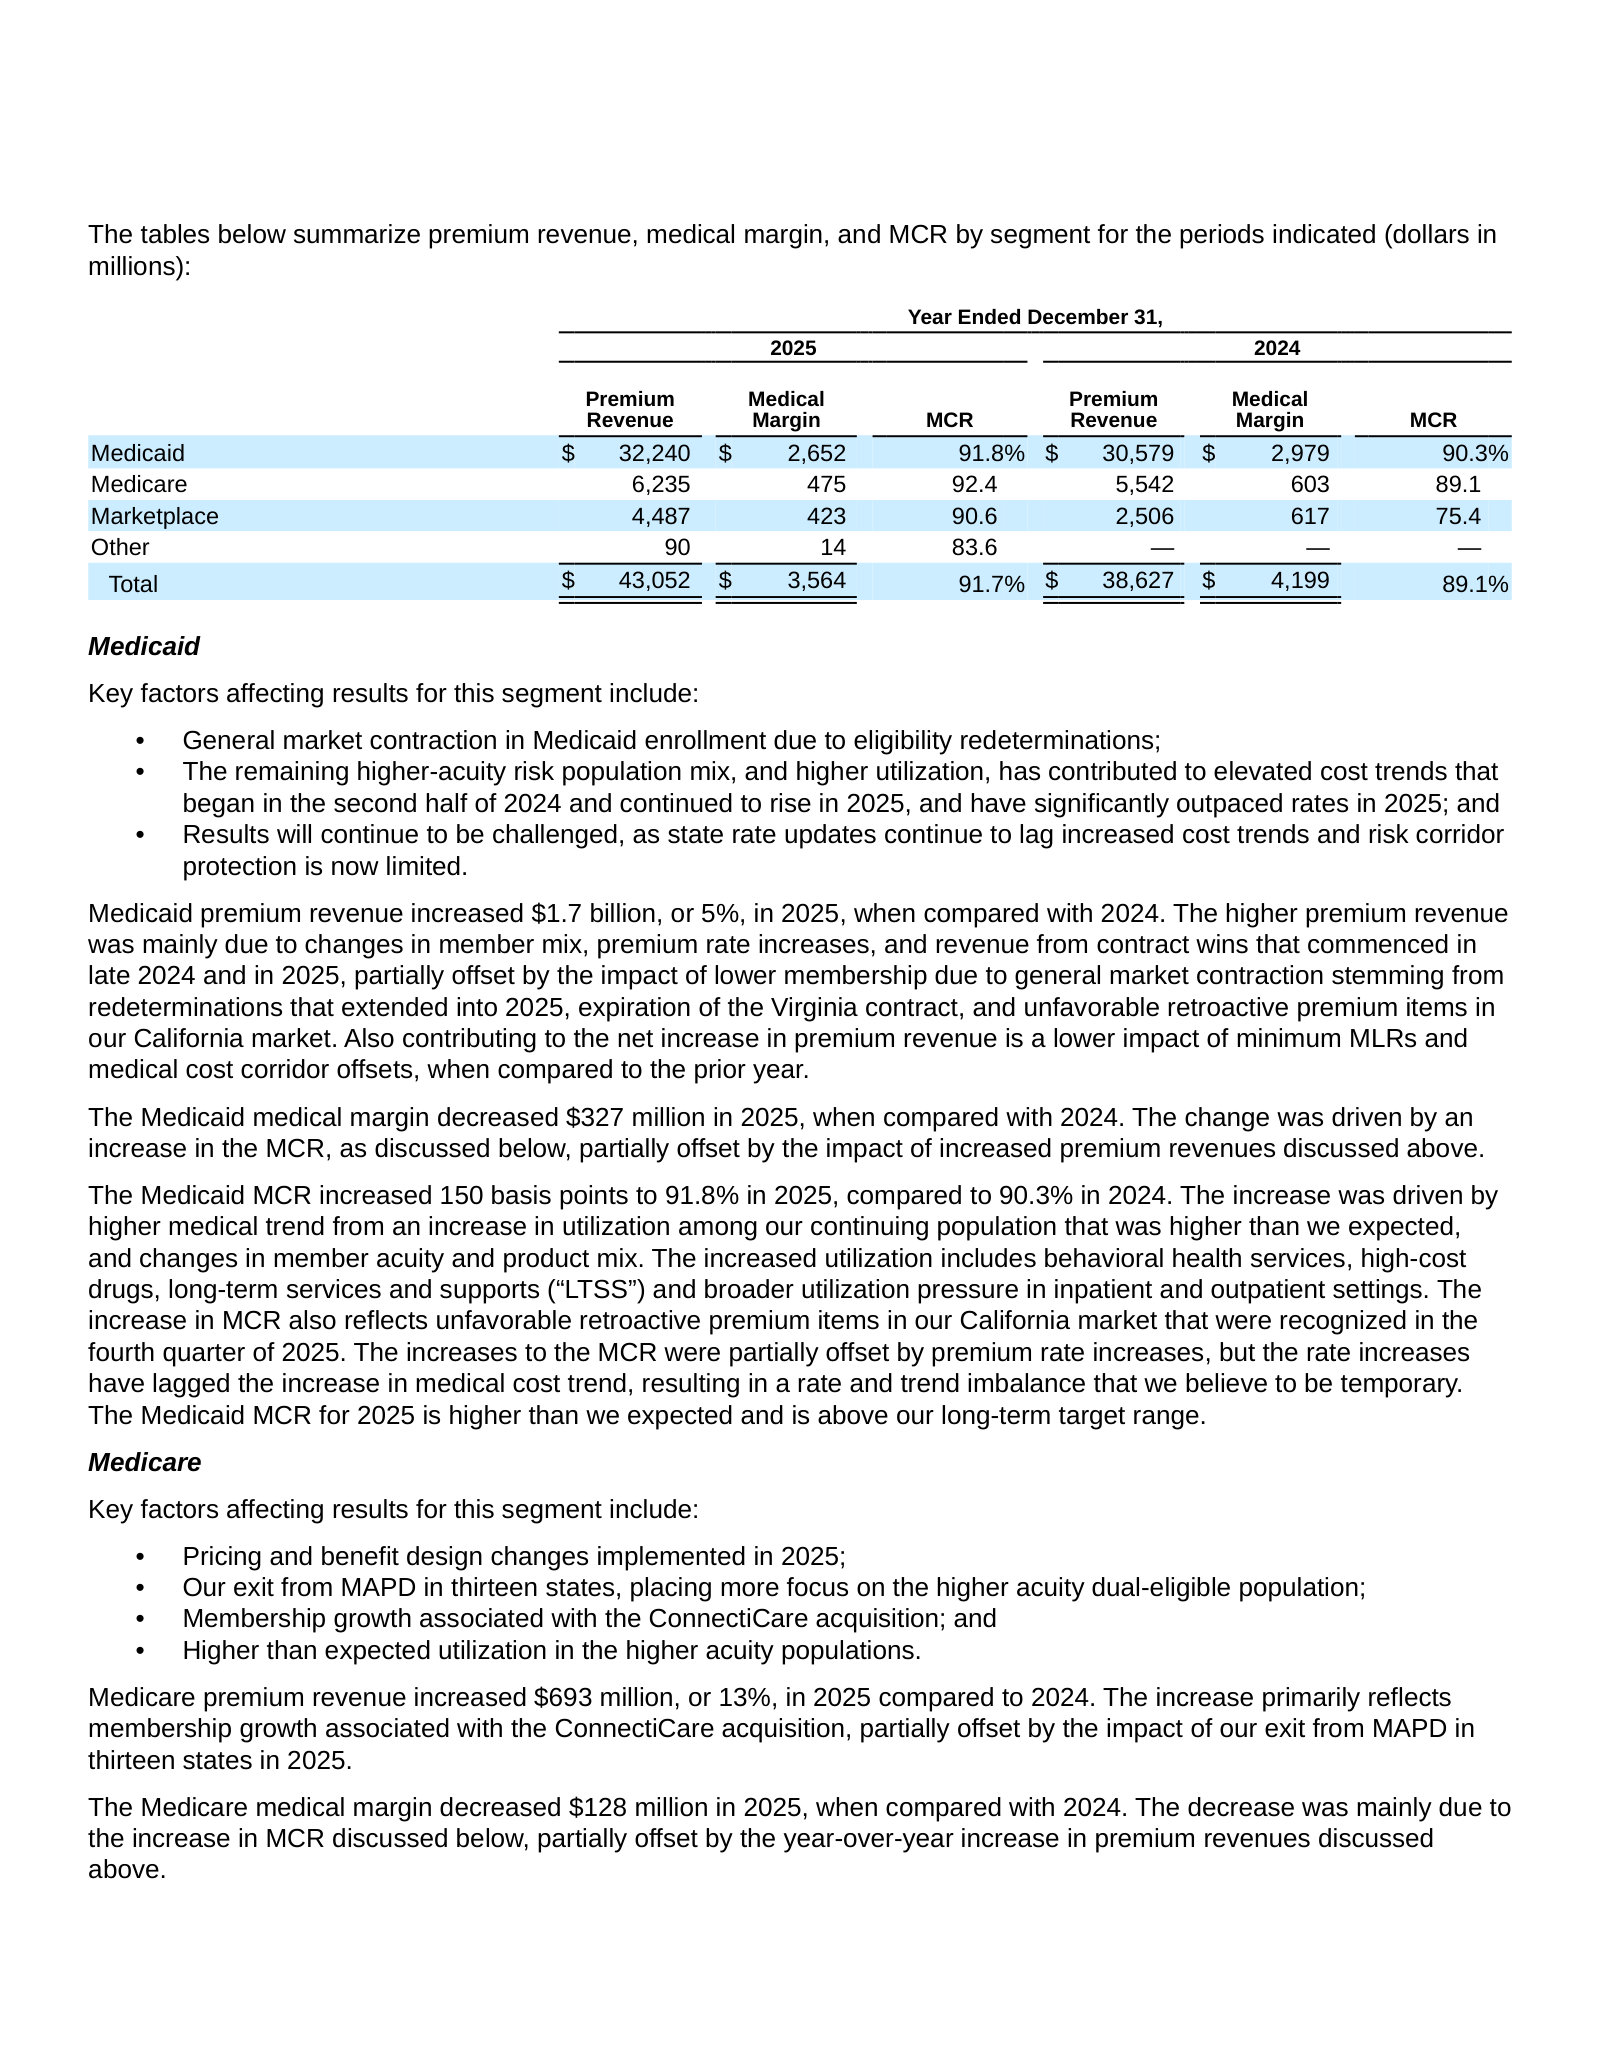
Medicaid MCR up 150bps on utilization; rates lagging trend in a 'temporary' imbalance.
The Medicaid MCR increased 150 basis points to 91.8% in 2025, compared to 90.3% in 2024. The increase was driven by higher medical trend from an increase in utilization among our continuing population that was higher than we expected, and changes in member acuity and product mix. […] The increases to the MCR were partially offset by premium rate increases, but the rate increases have lagged the increase in medical cost trend, resulting in a rate and trend imbalance that we believe to be temporary.
p. 82 · Read in context →
Item 7. MD&A — Critical Accounting Estimates: Medical Claims and Benefits Payable — p. 94 · Read the full section →
The one estimate that defines a capitated insurer's earnings — IBNP reserves built on completion factors and cost-trend assumptions.
Why IBNP is the critical judgment: completion factors and healthcare cost trend drive the reserve.
The estimation of the IBNP liability requires considerable judgment in applying actuarial methods, determining the appropriate assumptions, and considering numerous factors. Of those factors, we consider estimated completion factors (measures the cumulative percentage of claims expense that will ultimately be paid for a given month of service based on historical payment patterns) and the assumed healthcare cost trend (percent change in per-member per-month incurred medical care costs) to be the most critical assumptions.
p. 94 · Read in context →
More annual reports
Molina Healthcare, Inc. — FY2024 Annual Report (Form 10-K) — FY2024 · 155 pages · The peak-margin baseline (MCR 89.1%, EPS $20.42) against which the FY2025 compression reads. · Open →
Molina Healthcare, Inc. — FY2023 Annual Report (Form 10-K) — FY2023 · 151 pages · Captures the Medicaid redetermination unwind as pandemic continuous-enrollment protections lapsed. · Open →
Molina Healthcare, Inc. — FY2022 Annual Report (Form 10-K) — FY2022 · 142 pages · Peak-enrollment year still boosted by pandemic-era continuous Medicaid coverage. · Open →
Molina Healthcare, Inc. — FY2021 Annual Report (Form 10-K) — FY2021 · 142 pages · The acquisition-fueled growth phase (Magellan Complete Care, Affinity) that built the current footprint. · Open →