Molina Healthcare, Inc.'s management explains the business in its own materials. The slides below do the most of that work, pulled from the documents preserved in Sources. Each source link opens the complete presentation at that slide in a new tab.
Management's fullest and most current statement of the business — franchise, segments, growth engines, the margin dislocation and the path to the 2029 targets. · Open the full document →
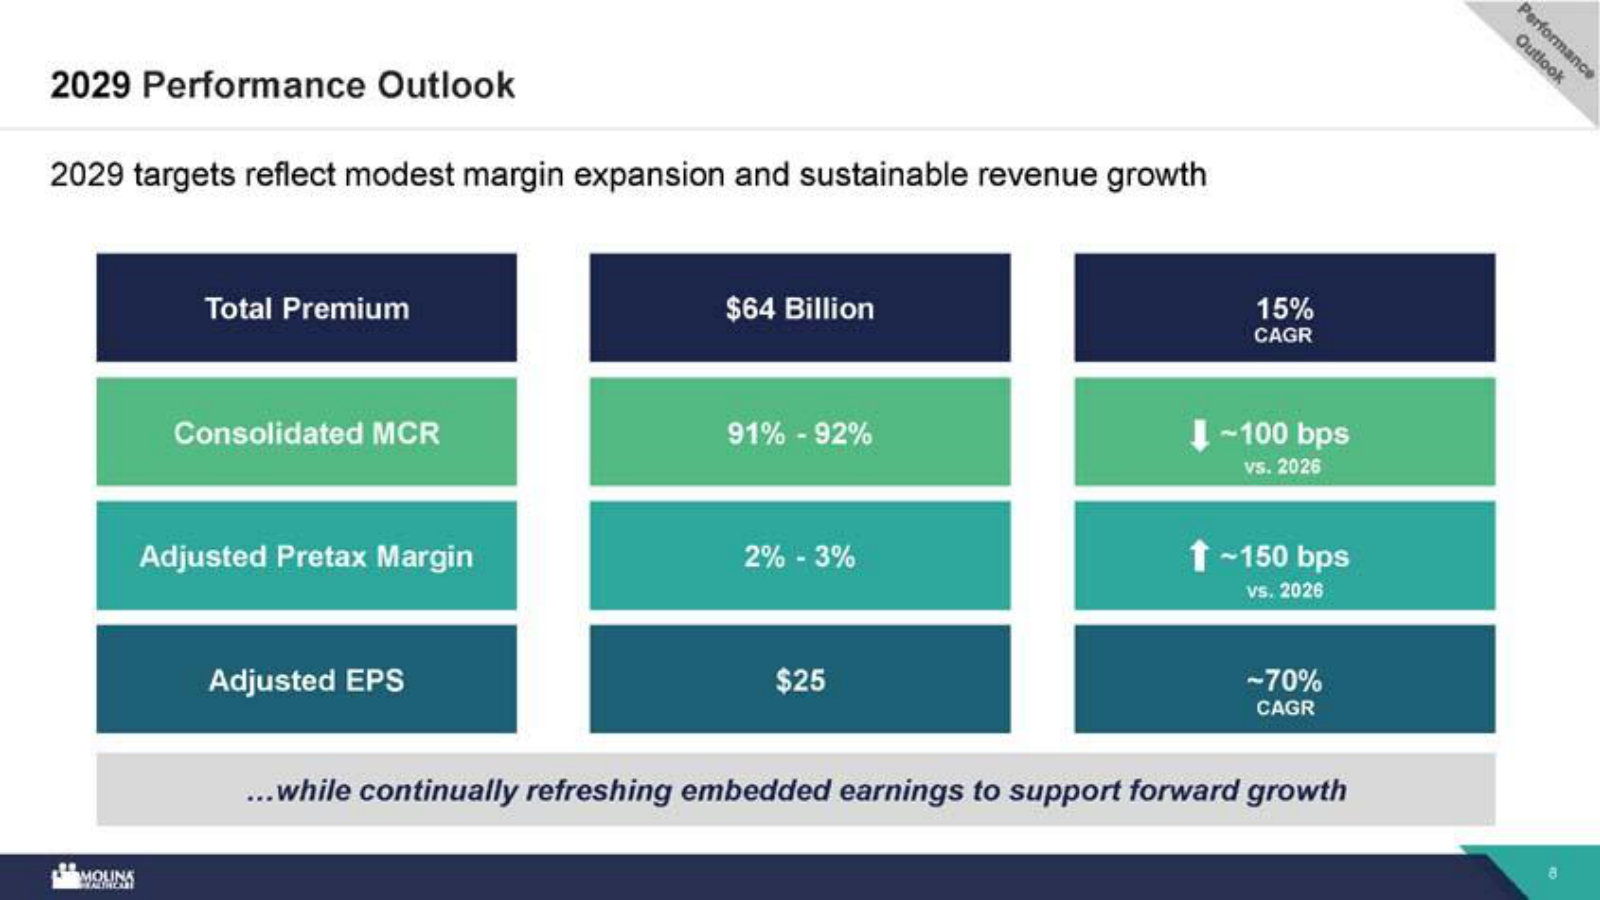
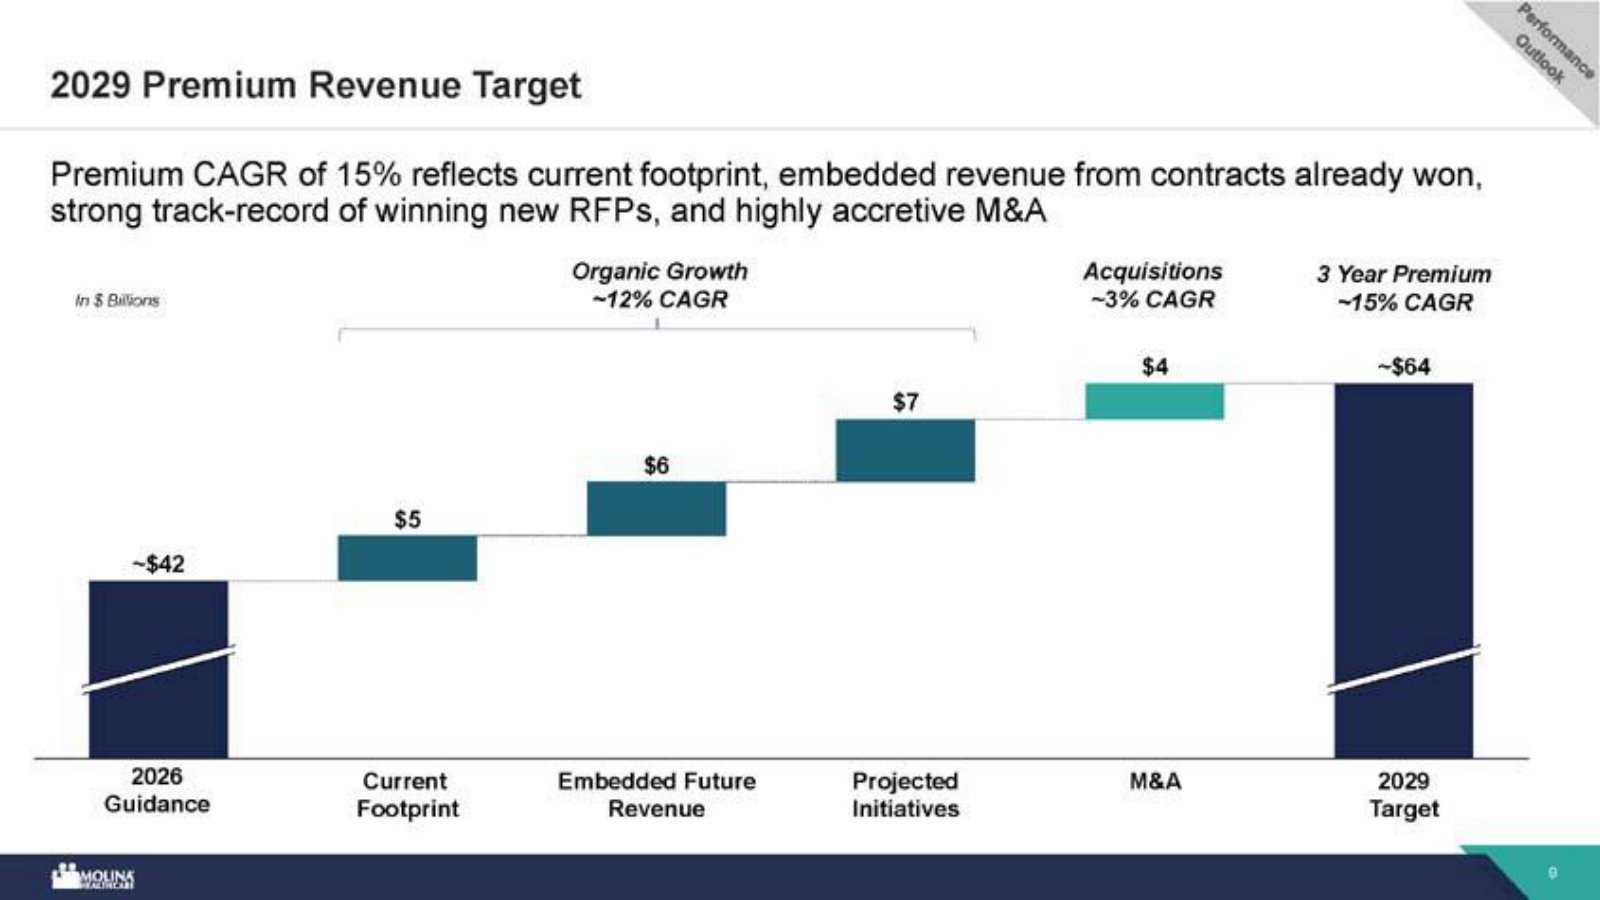
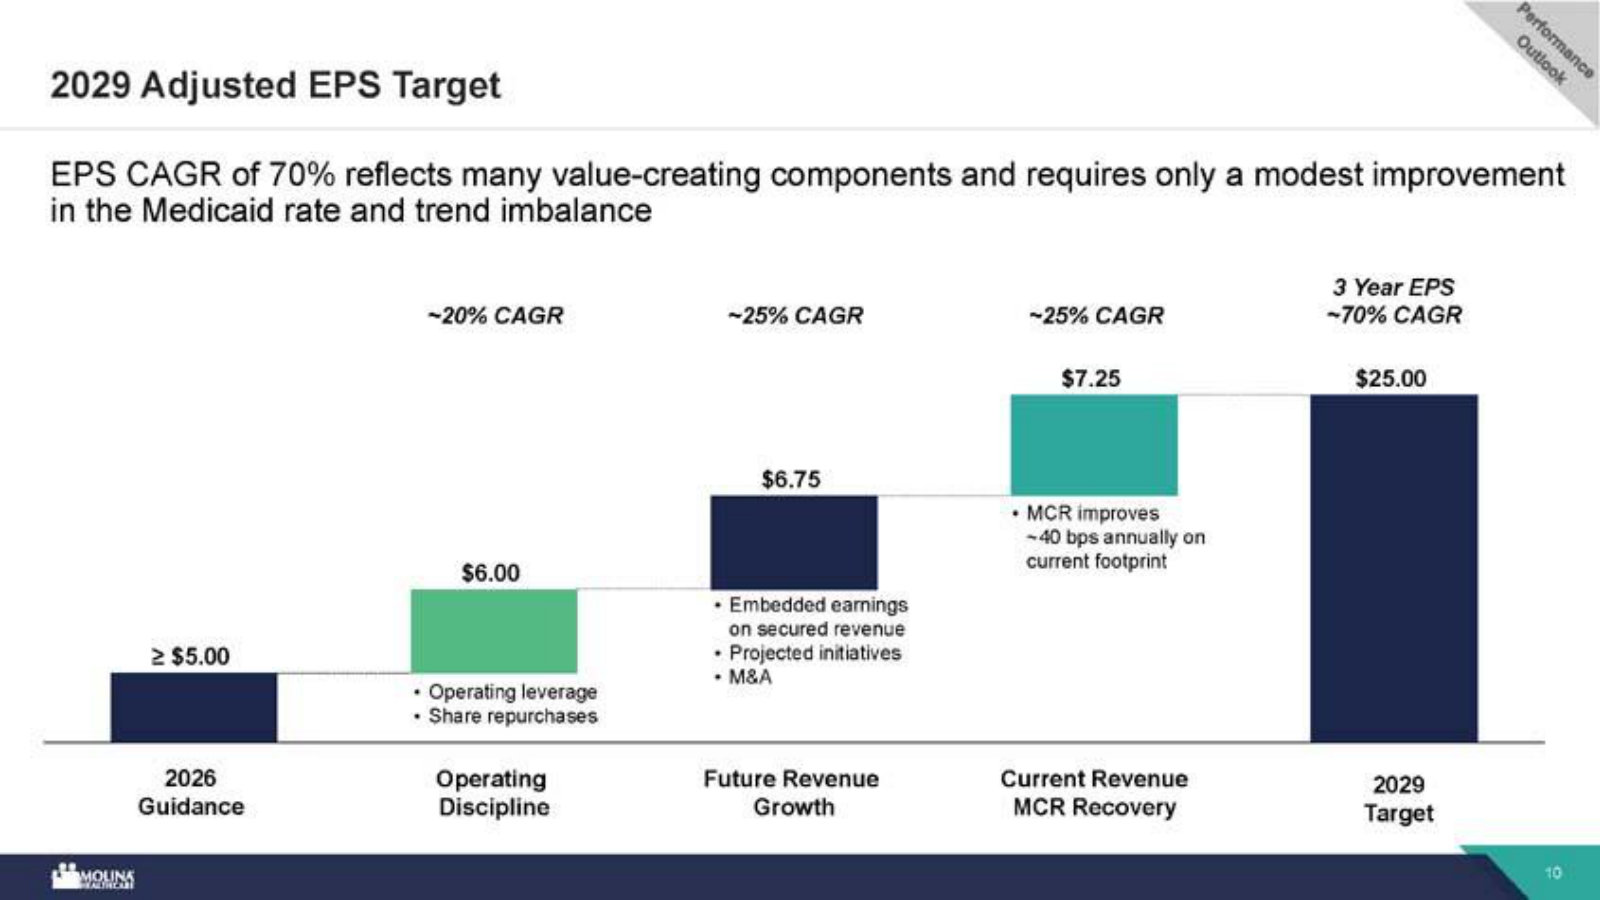
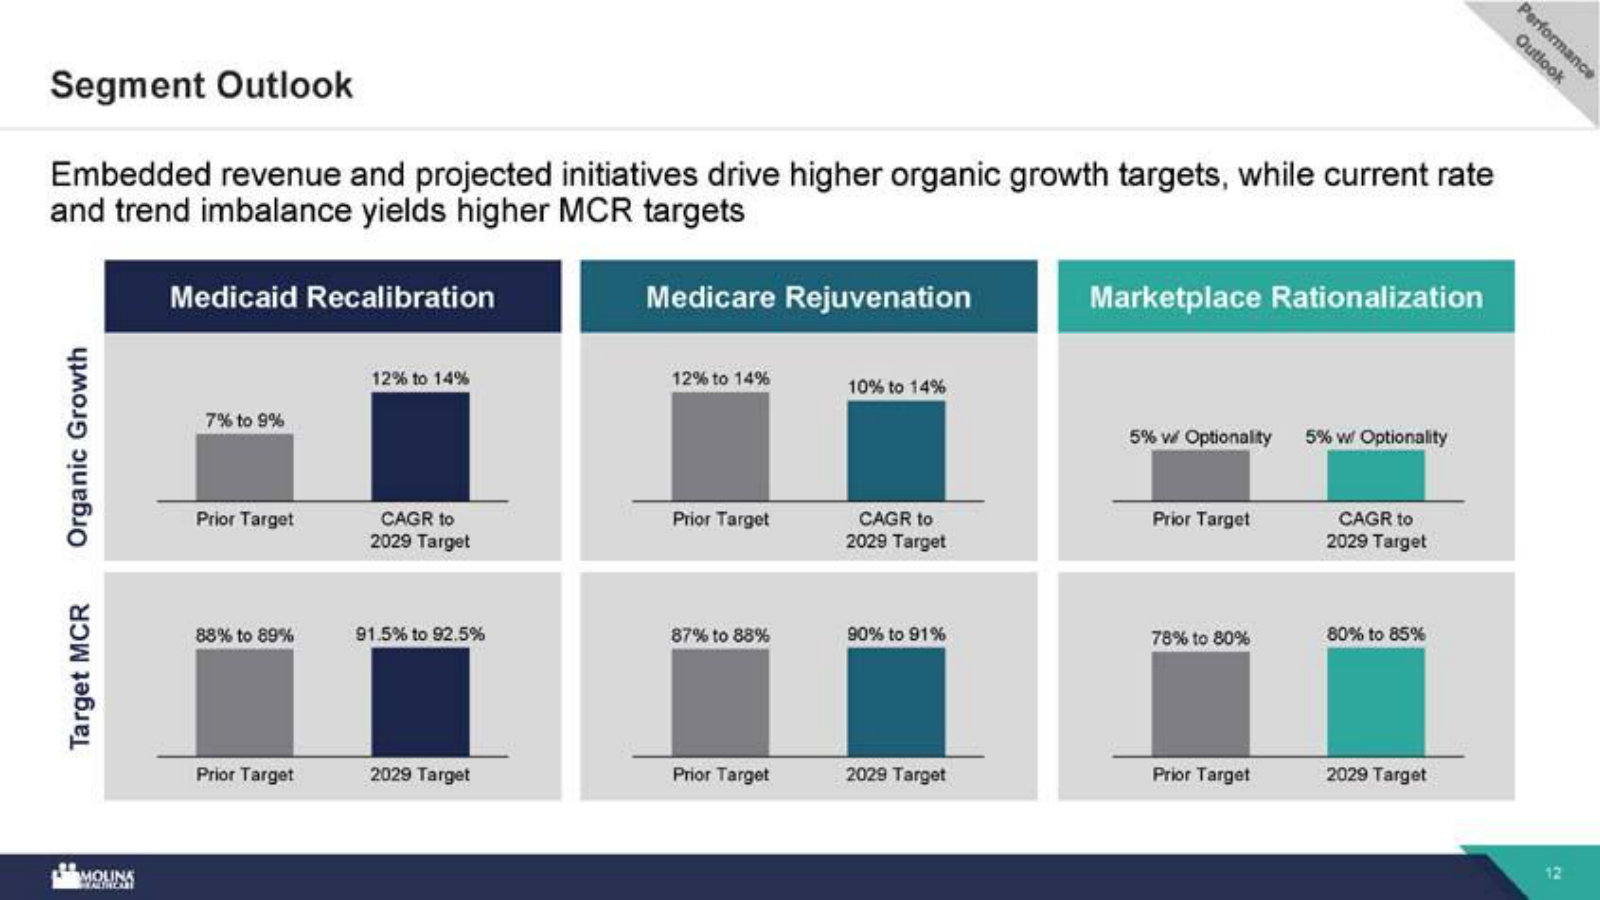
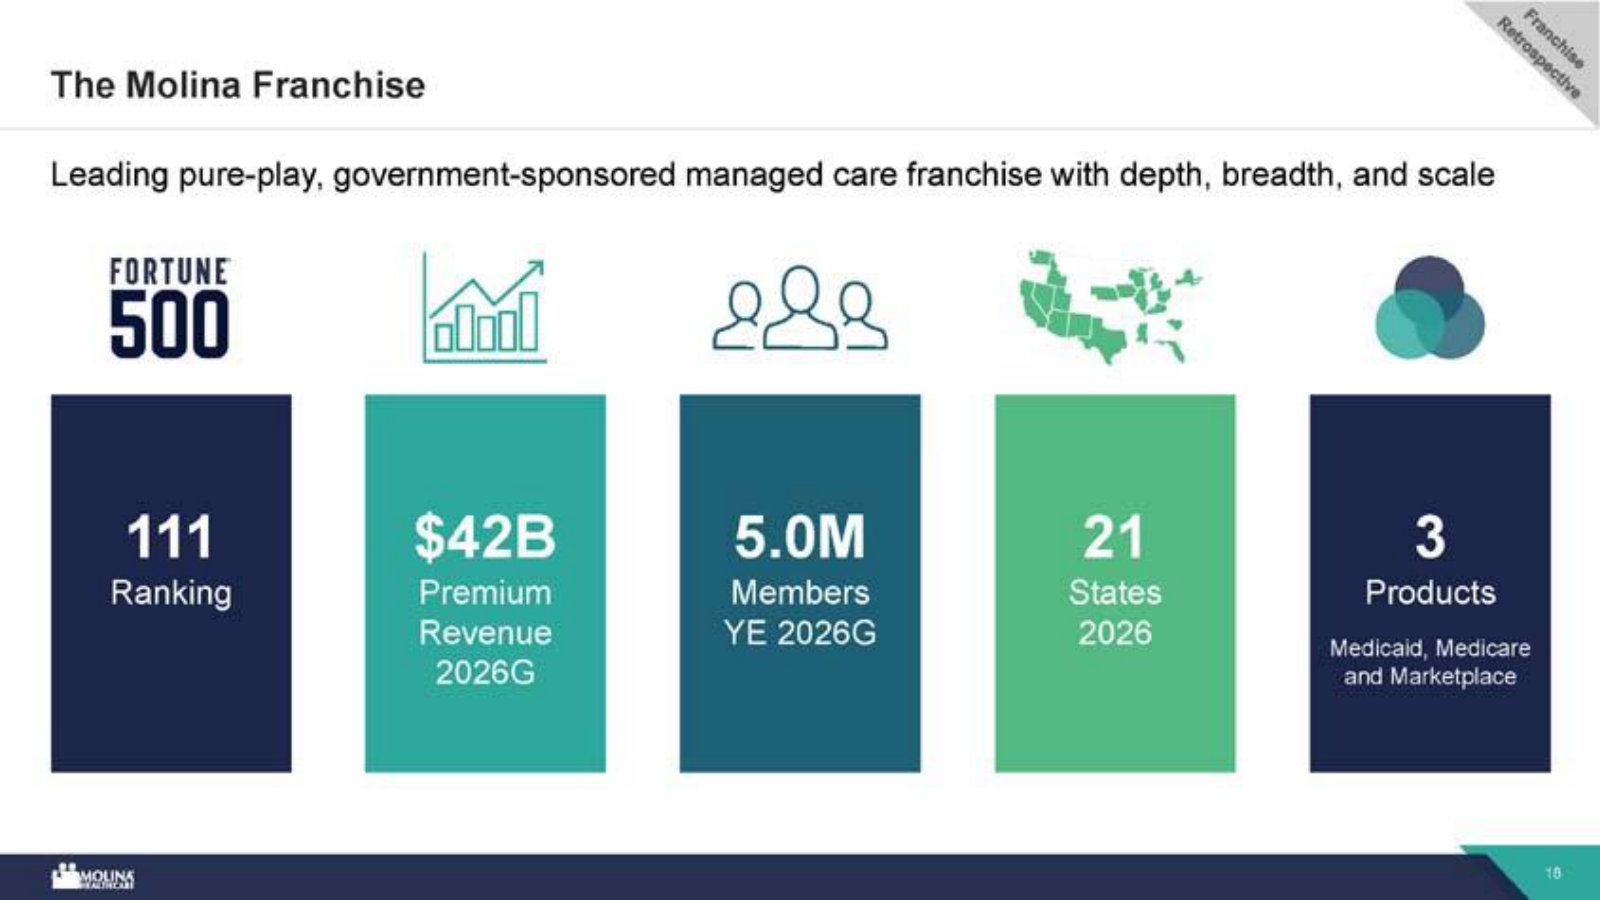
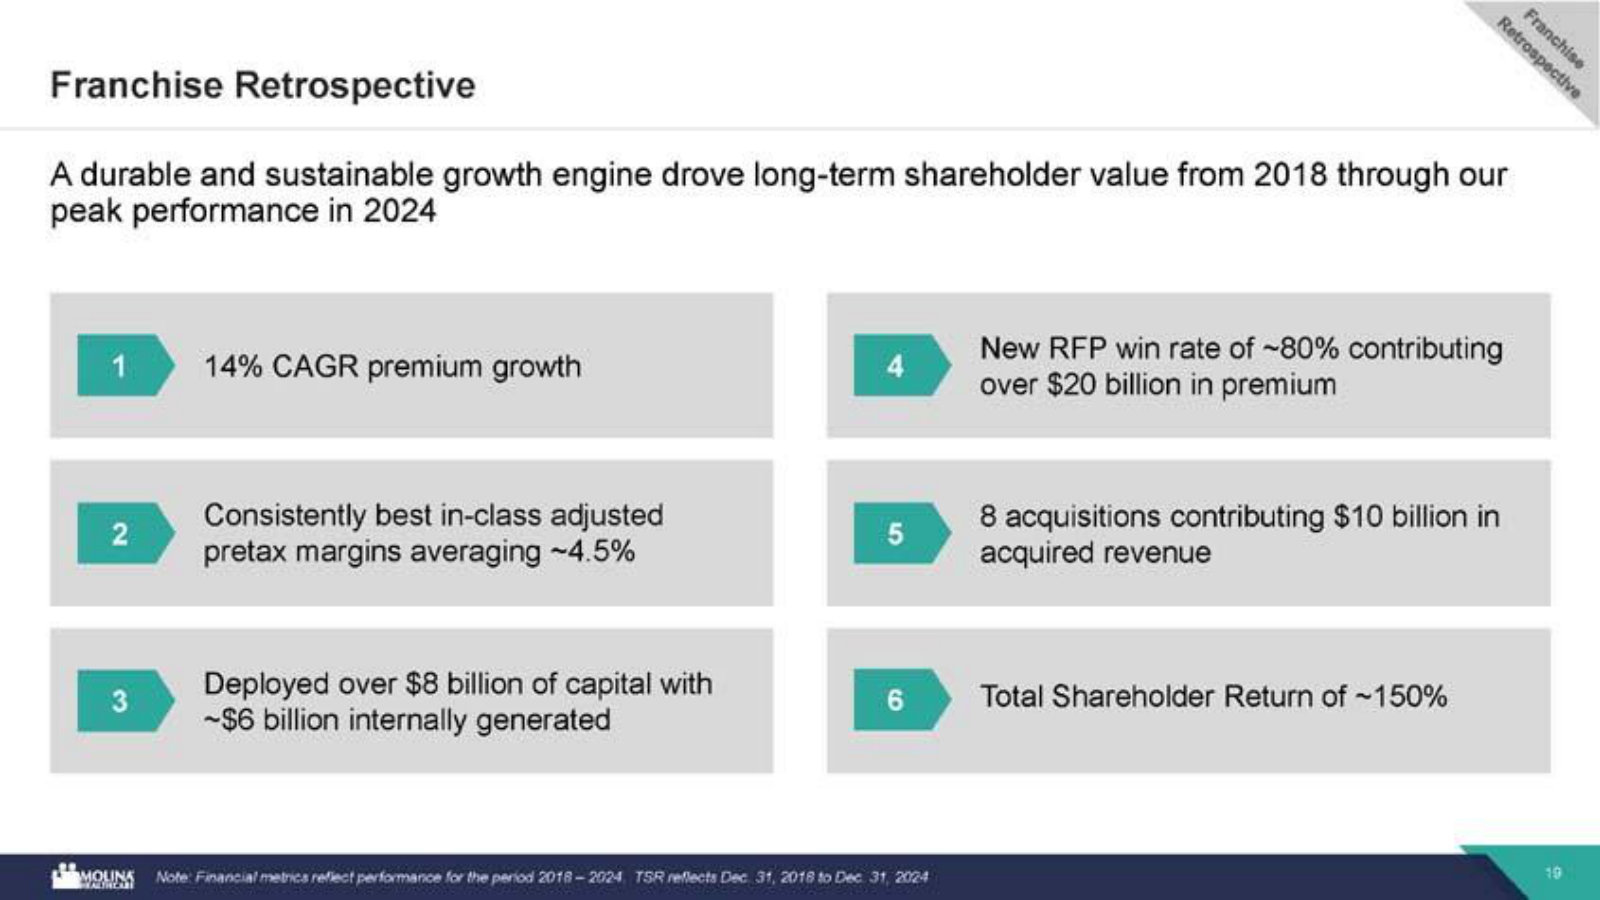
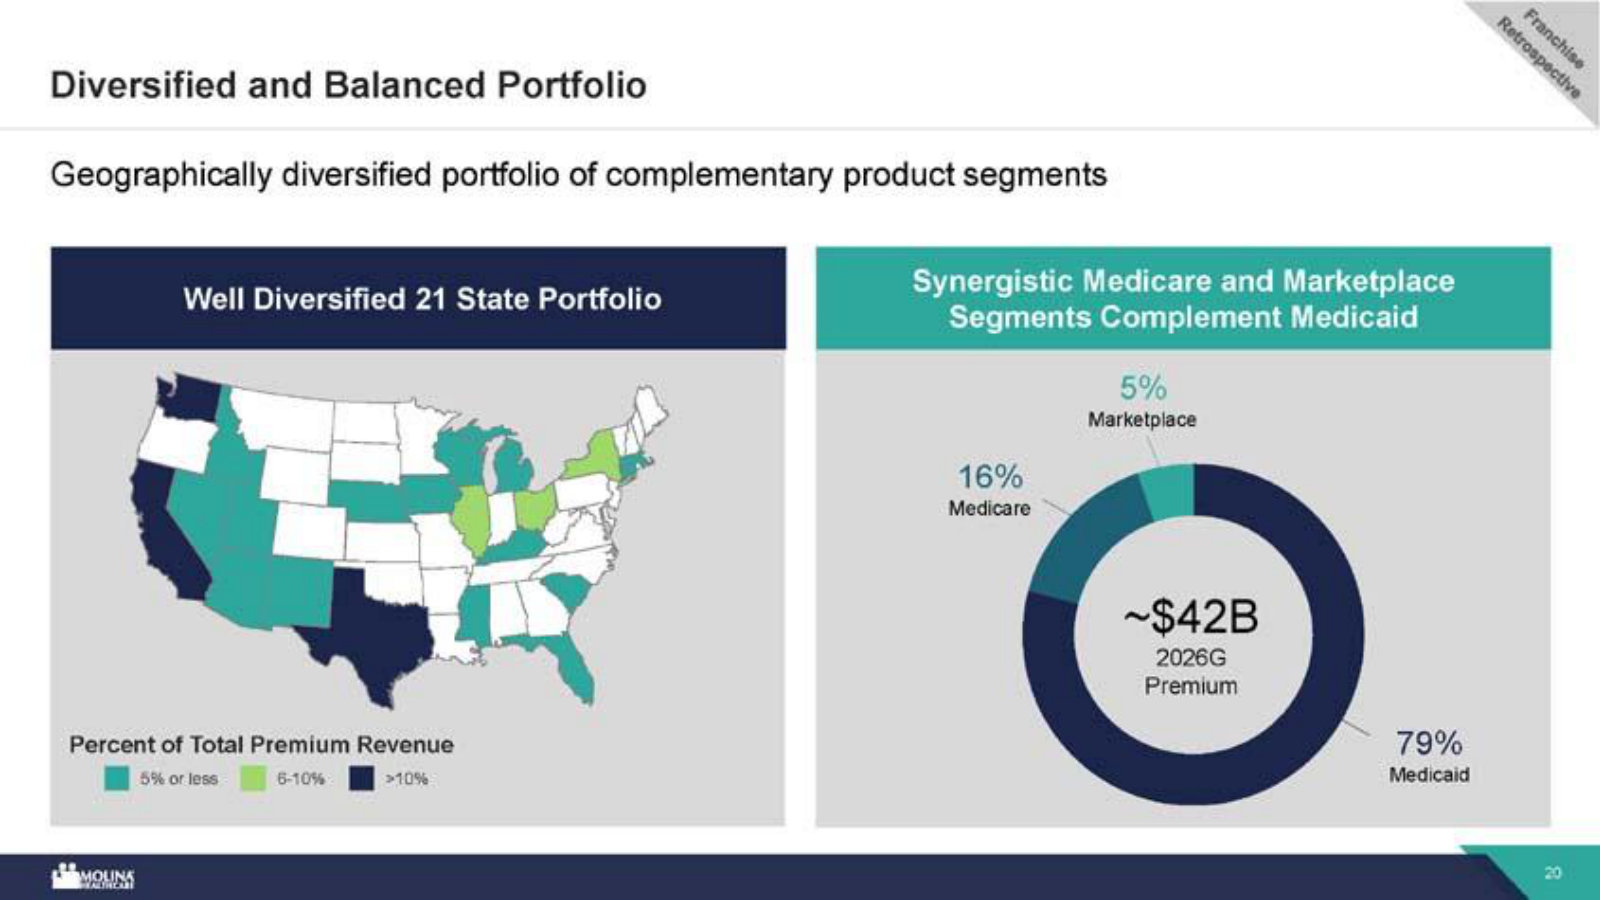
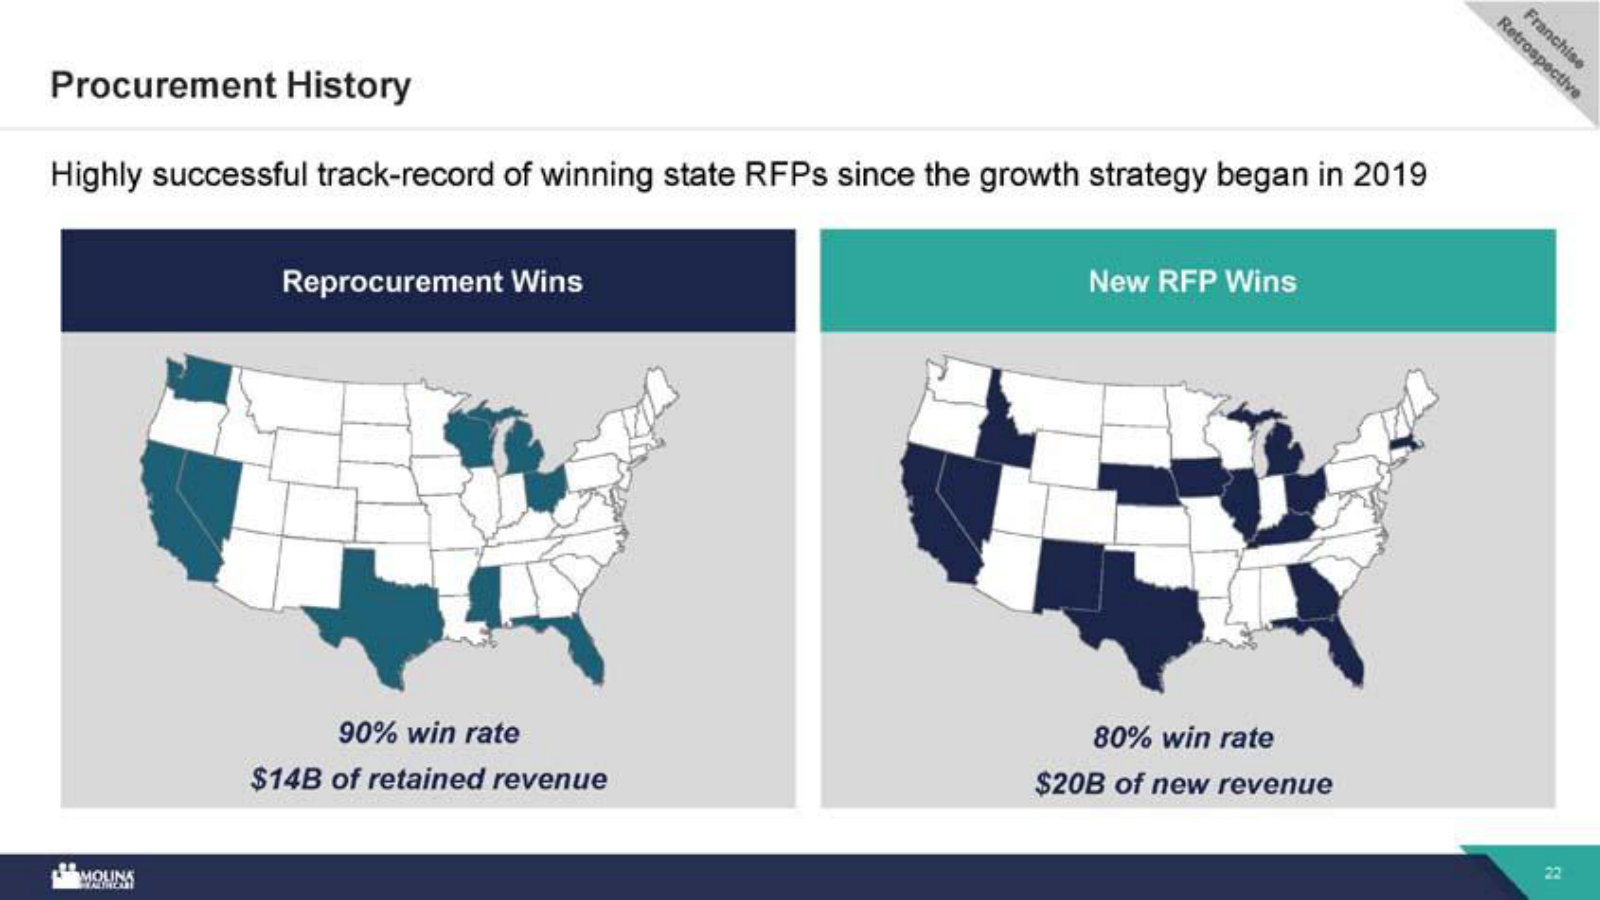
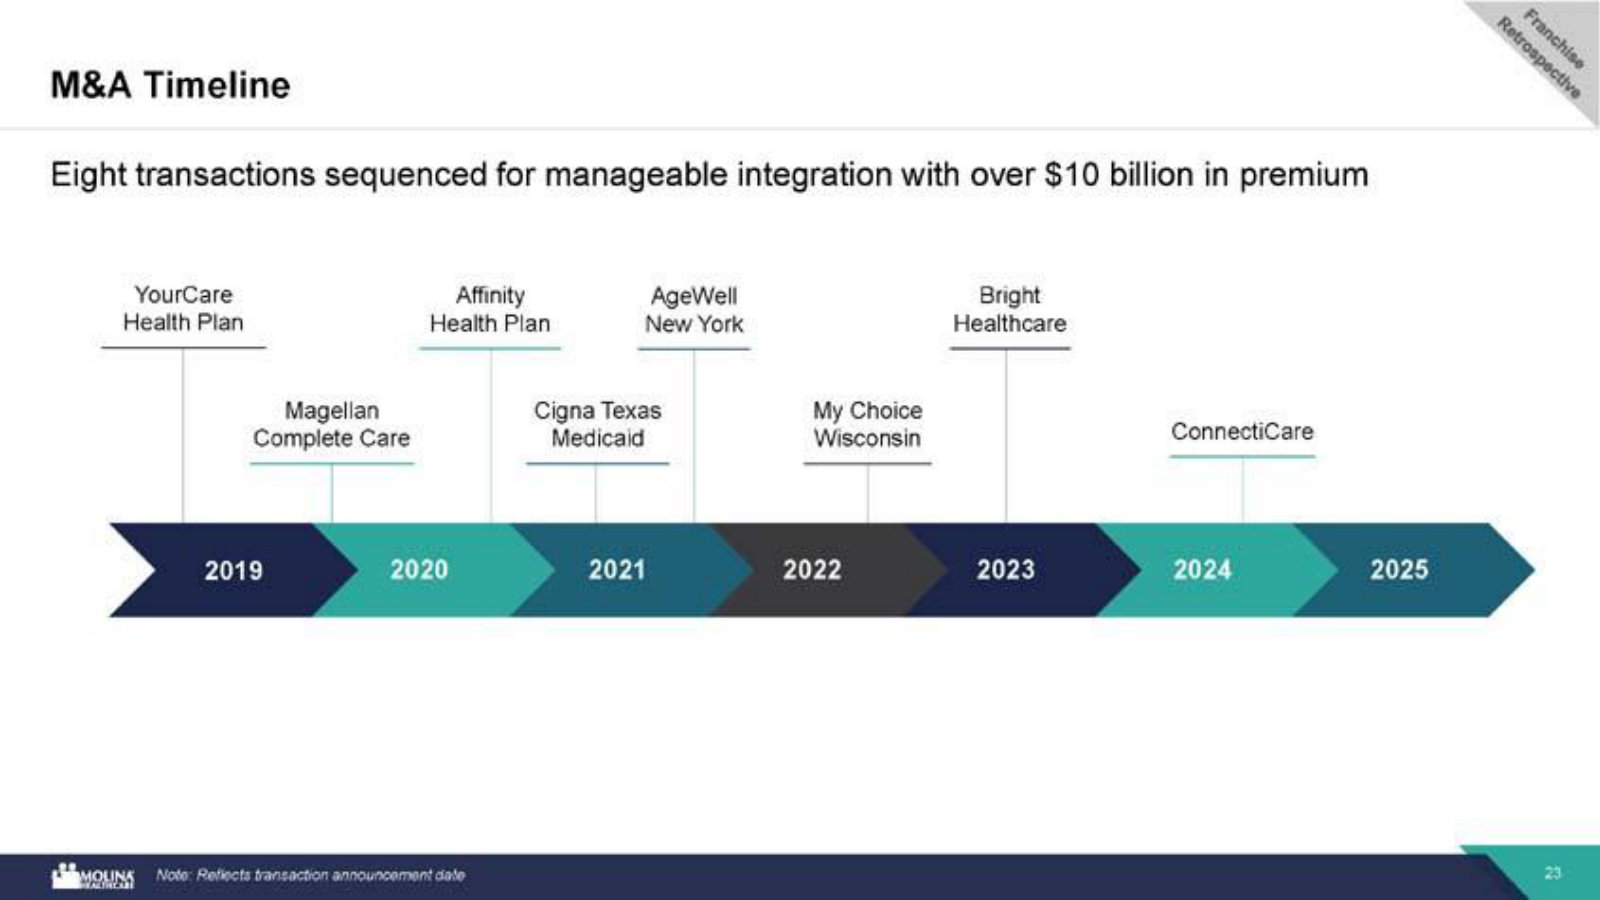
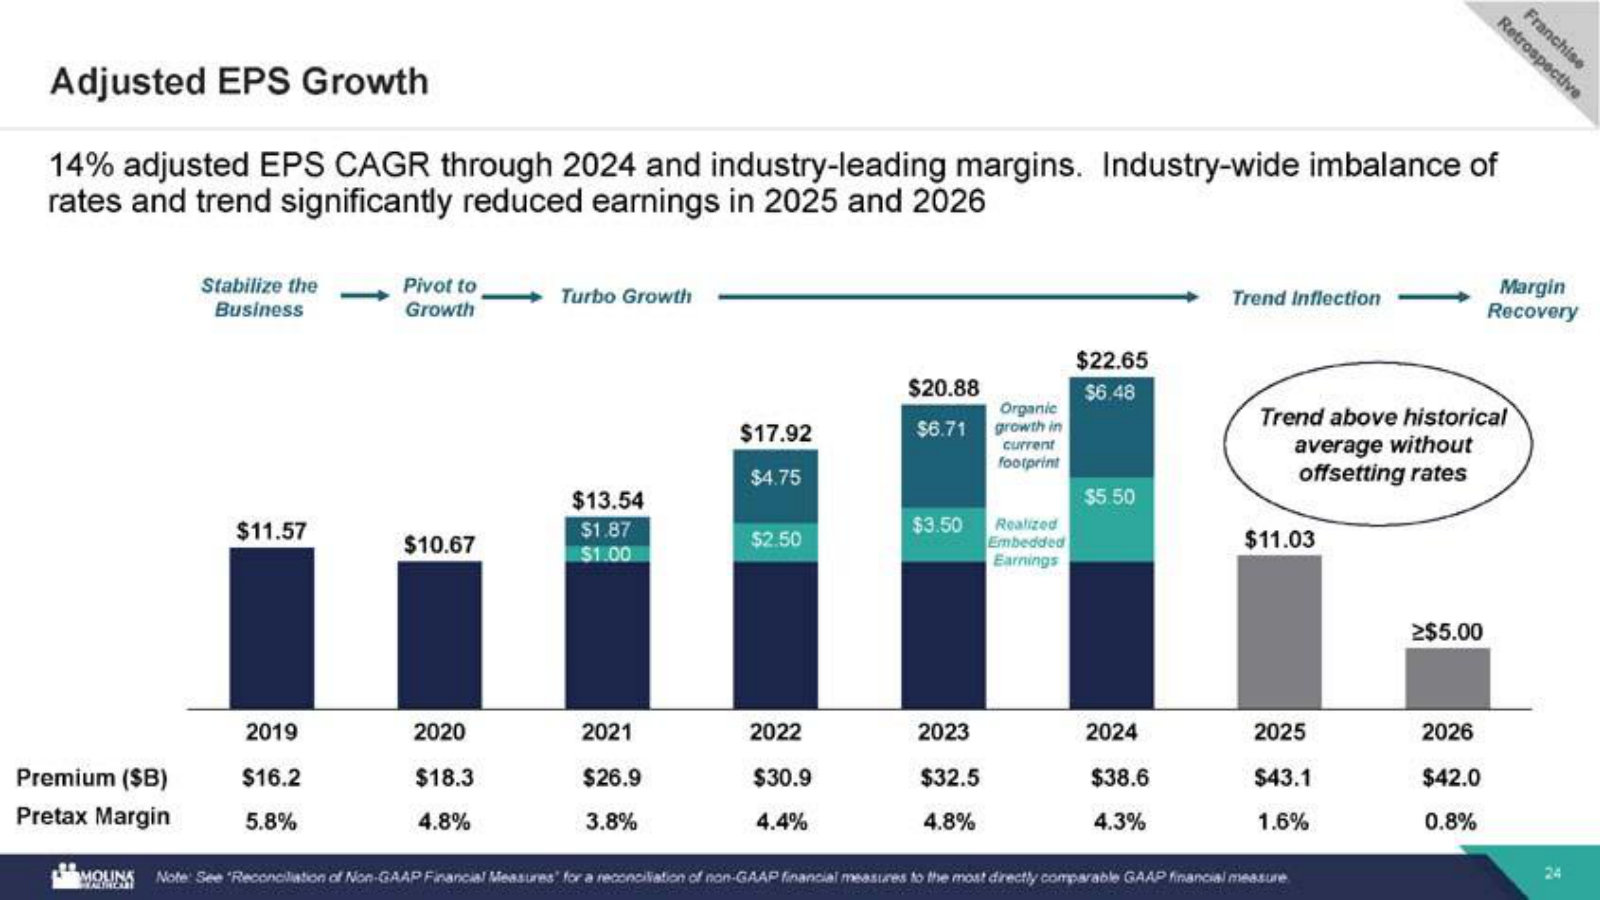
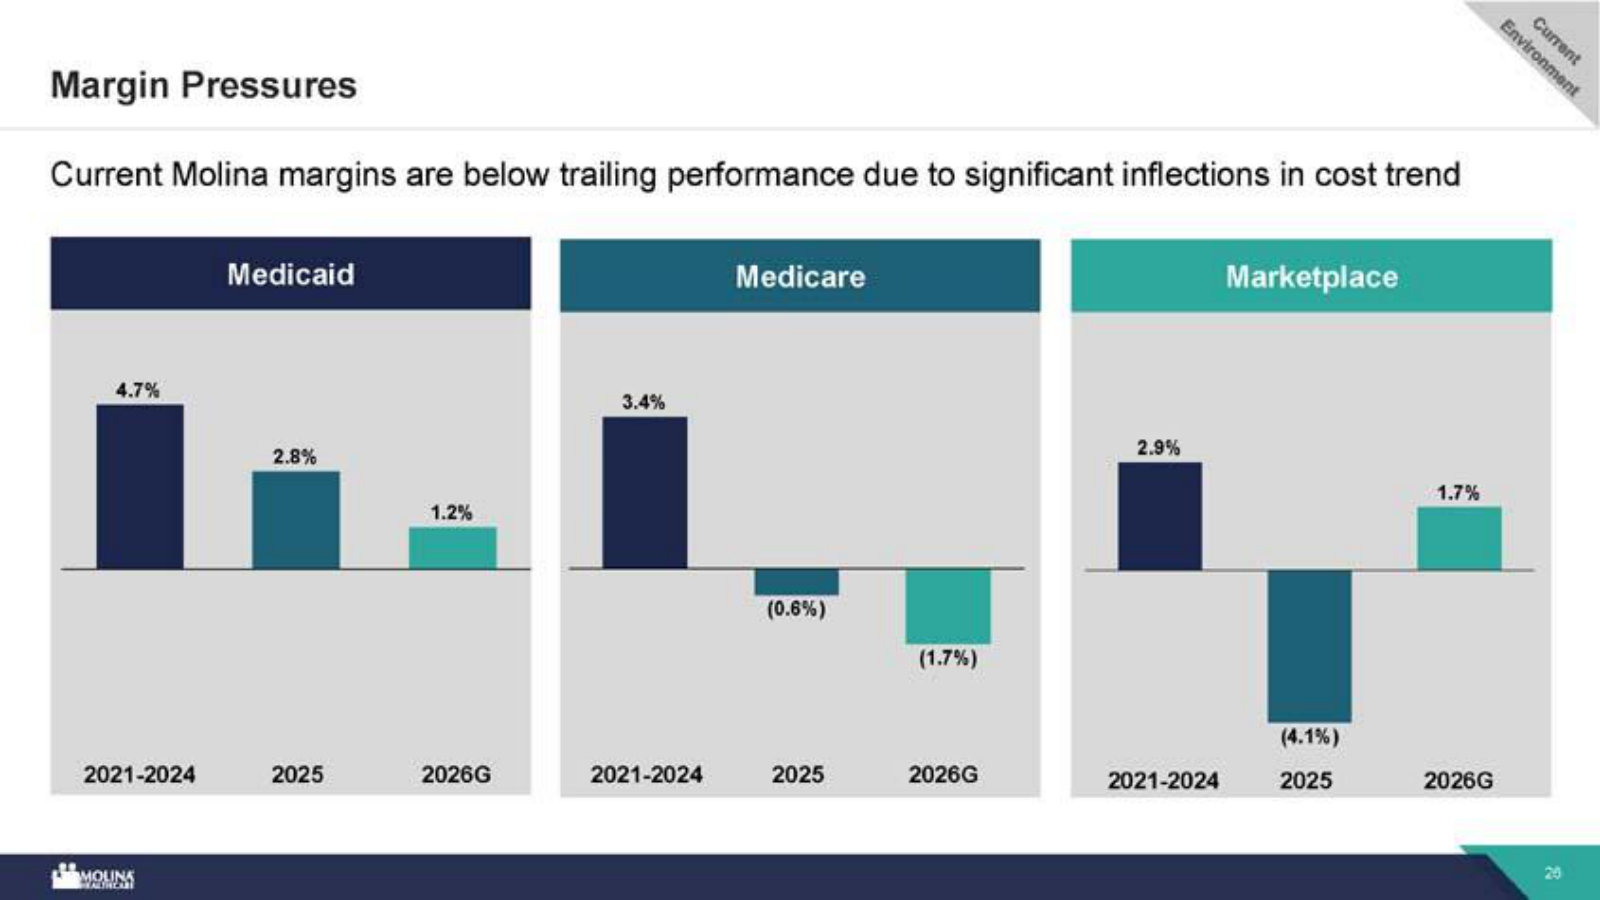
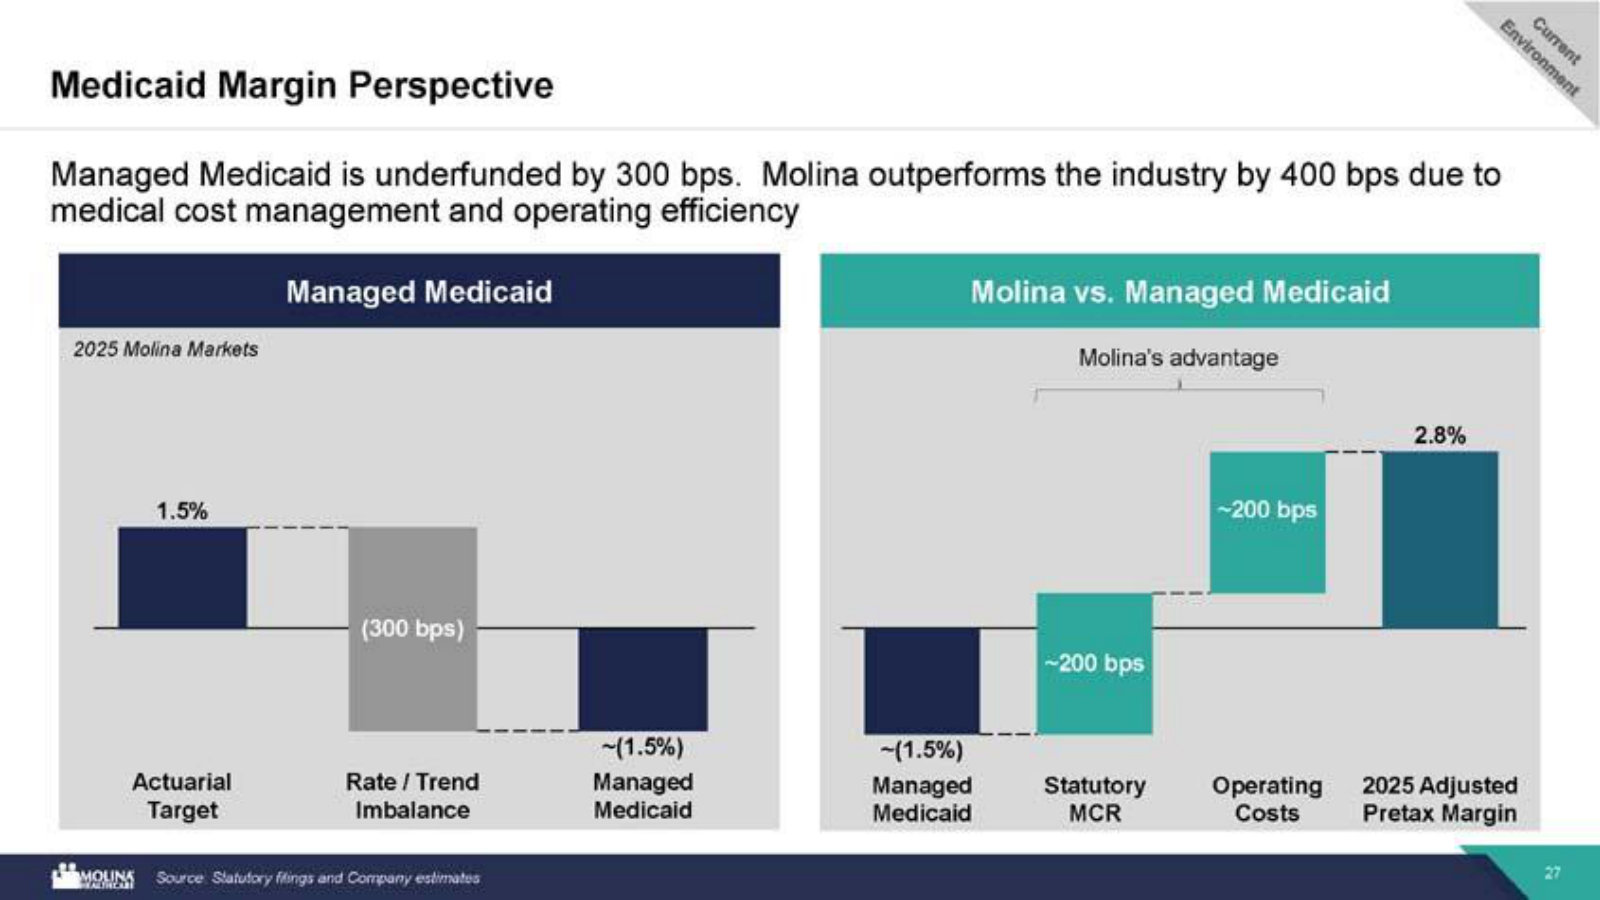
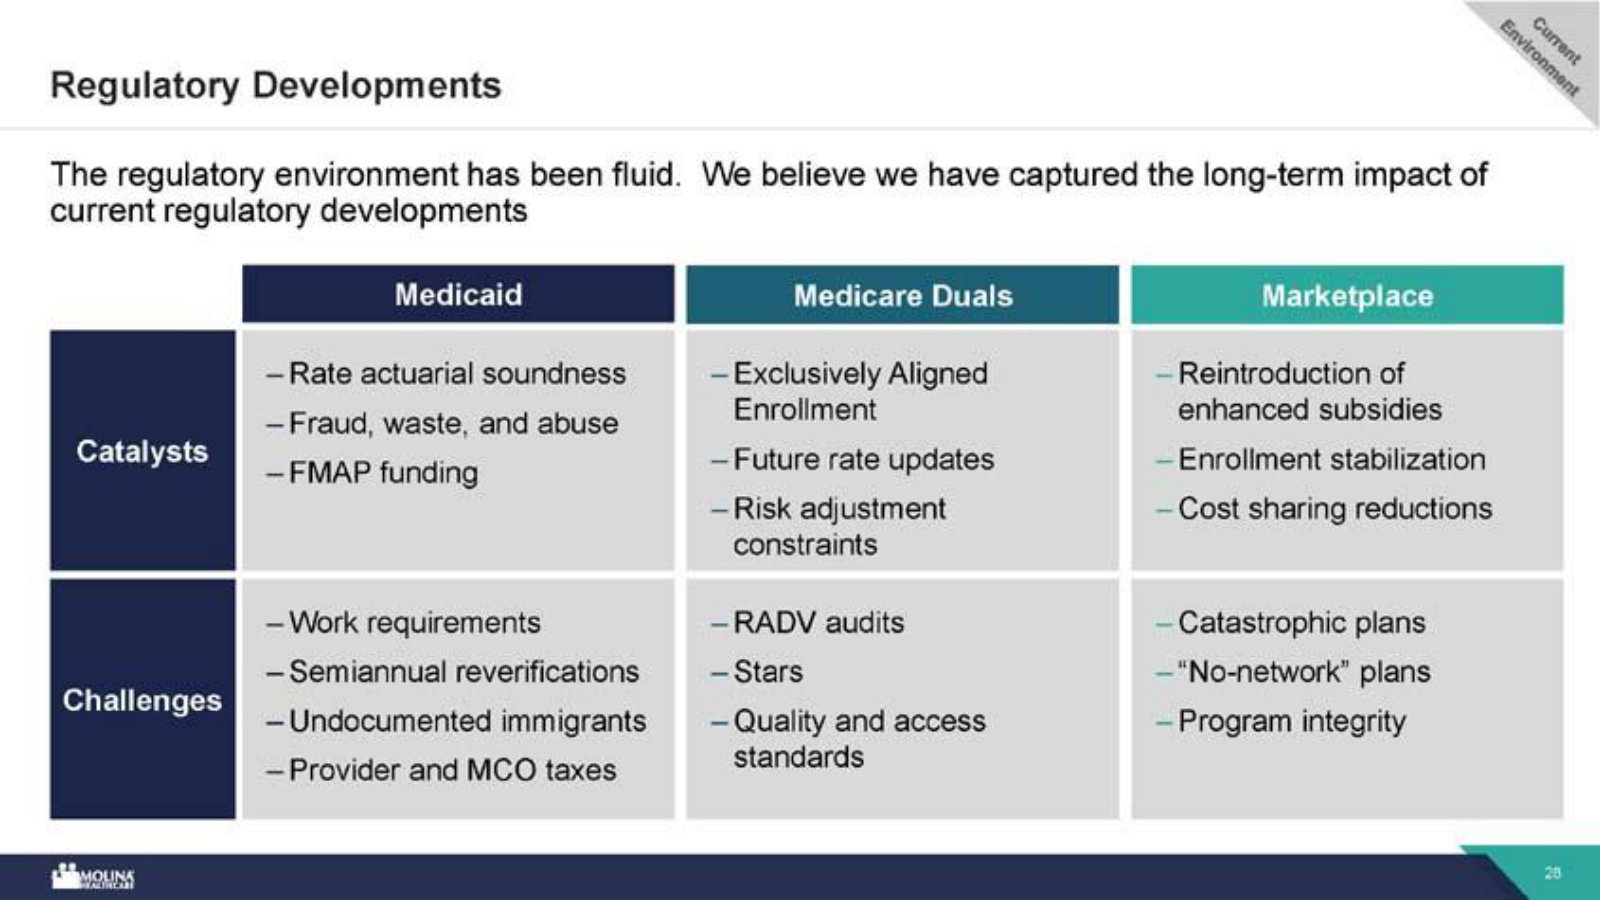
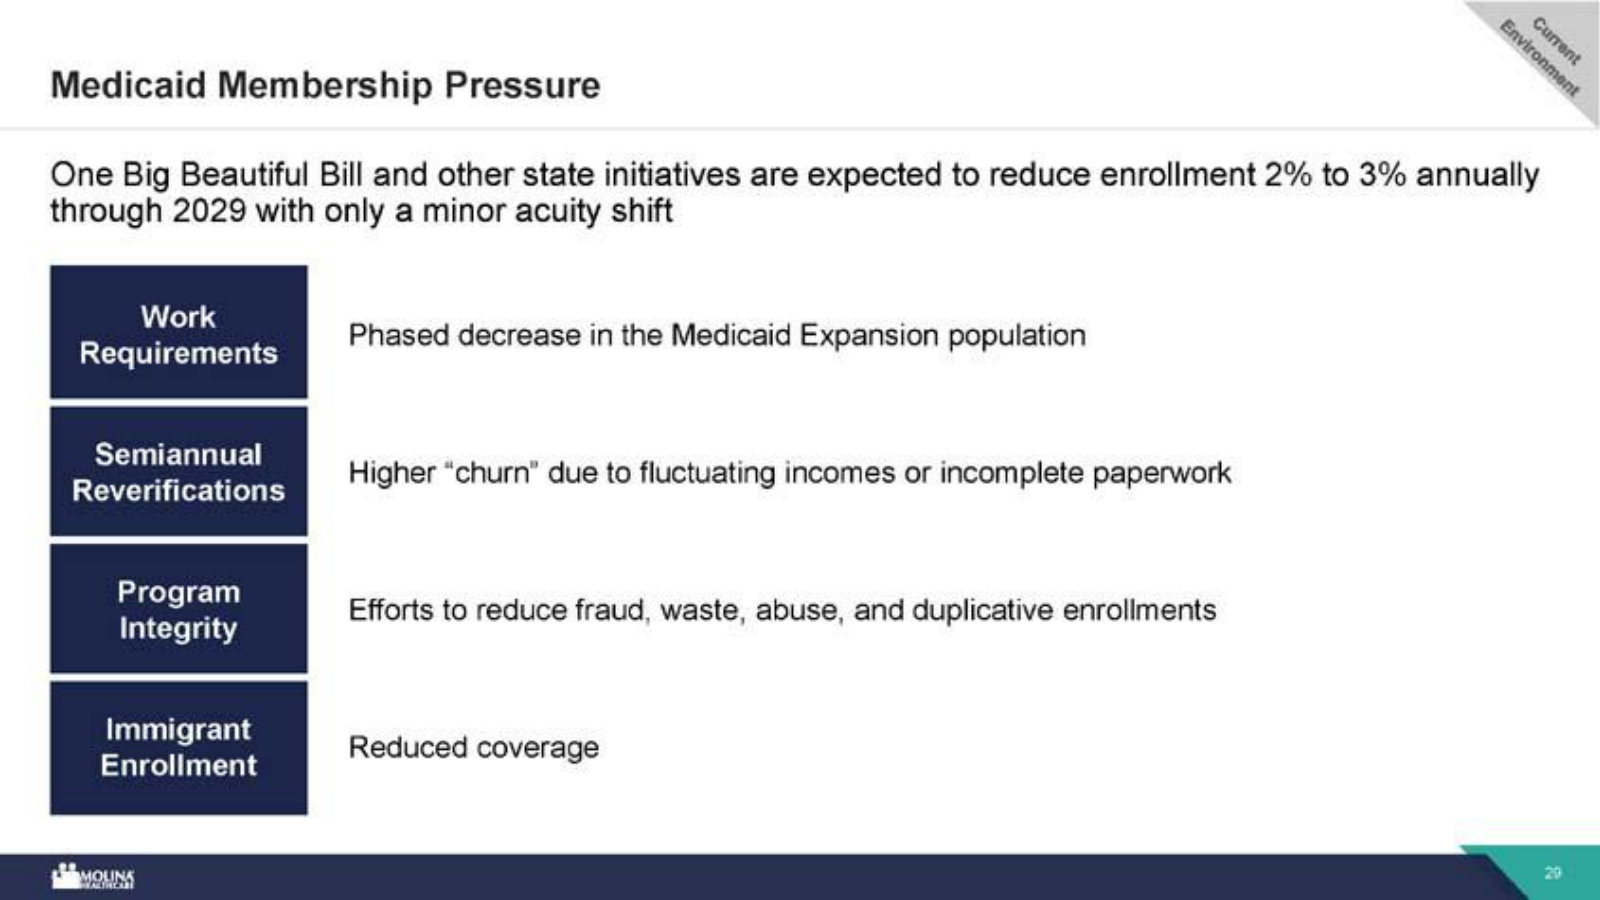
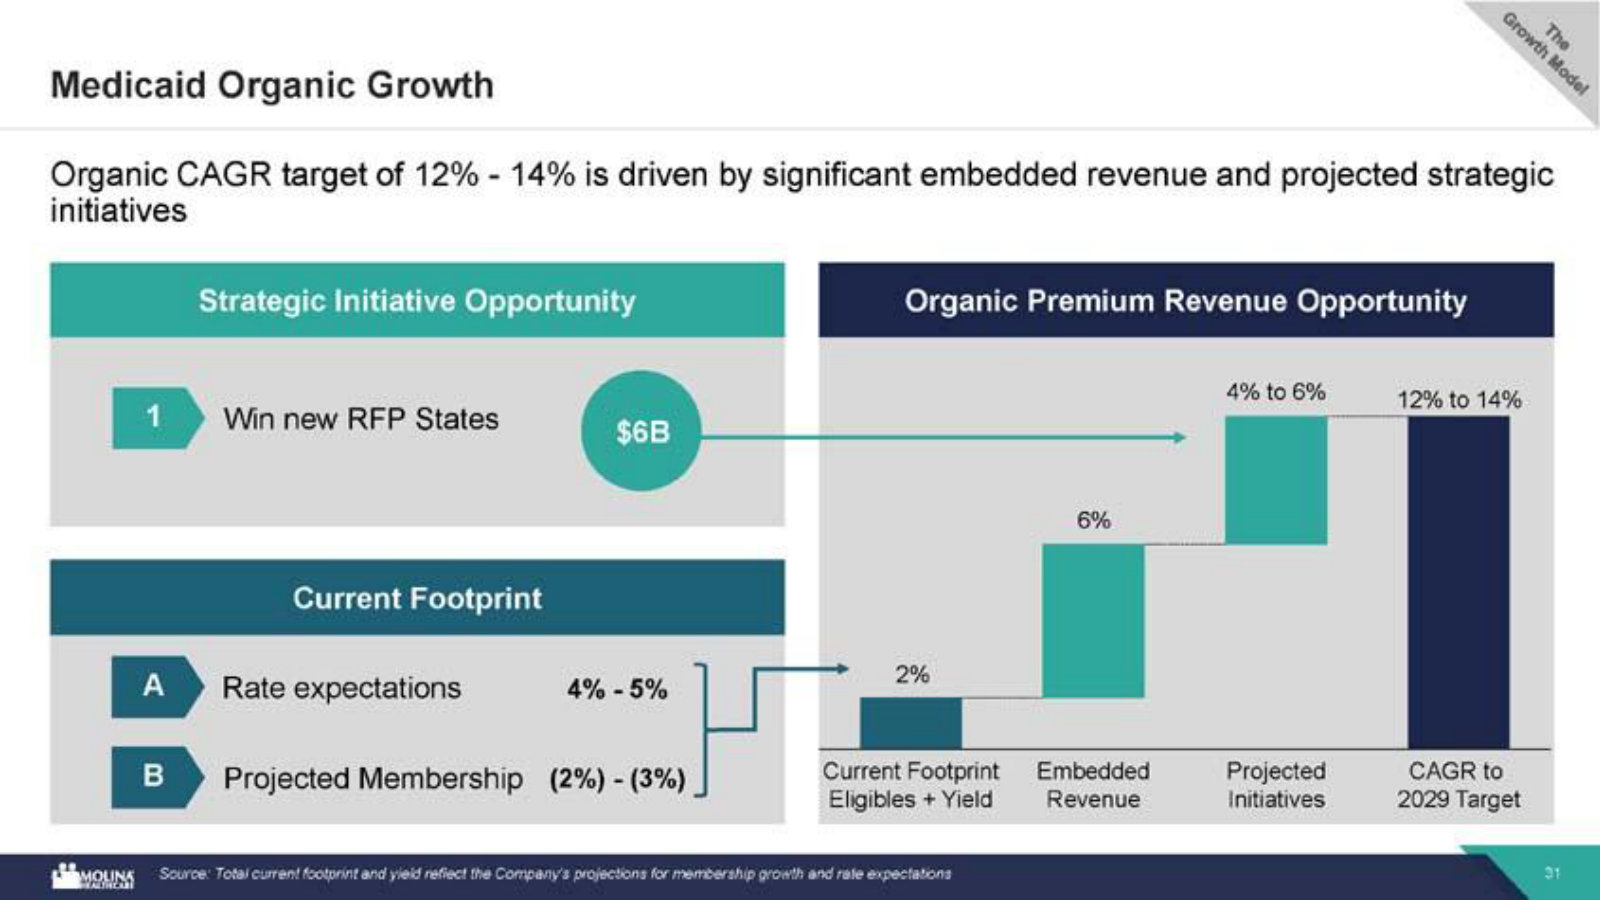
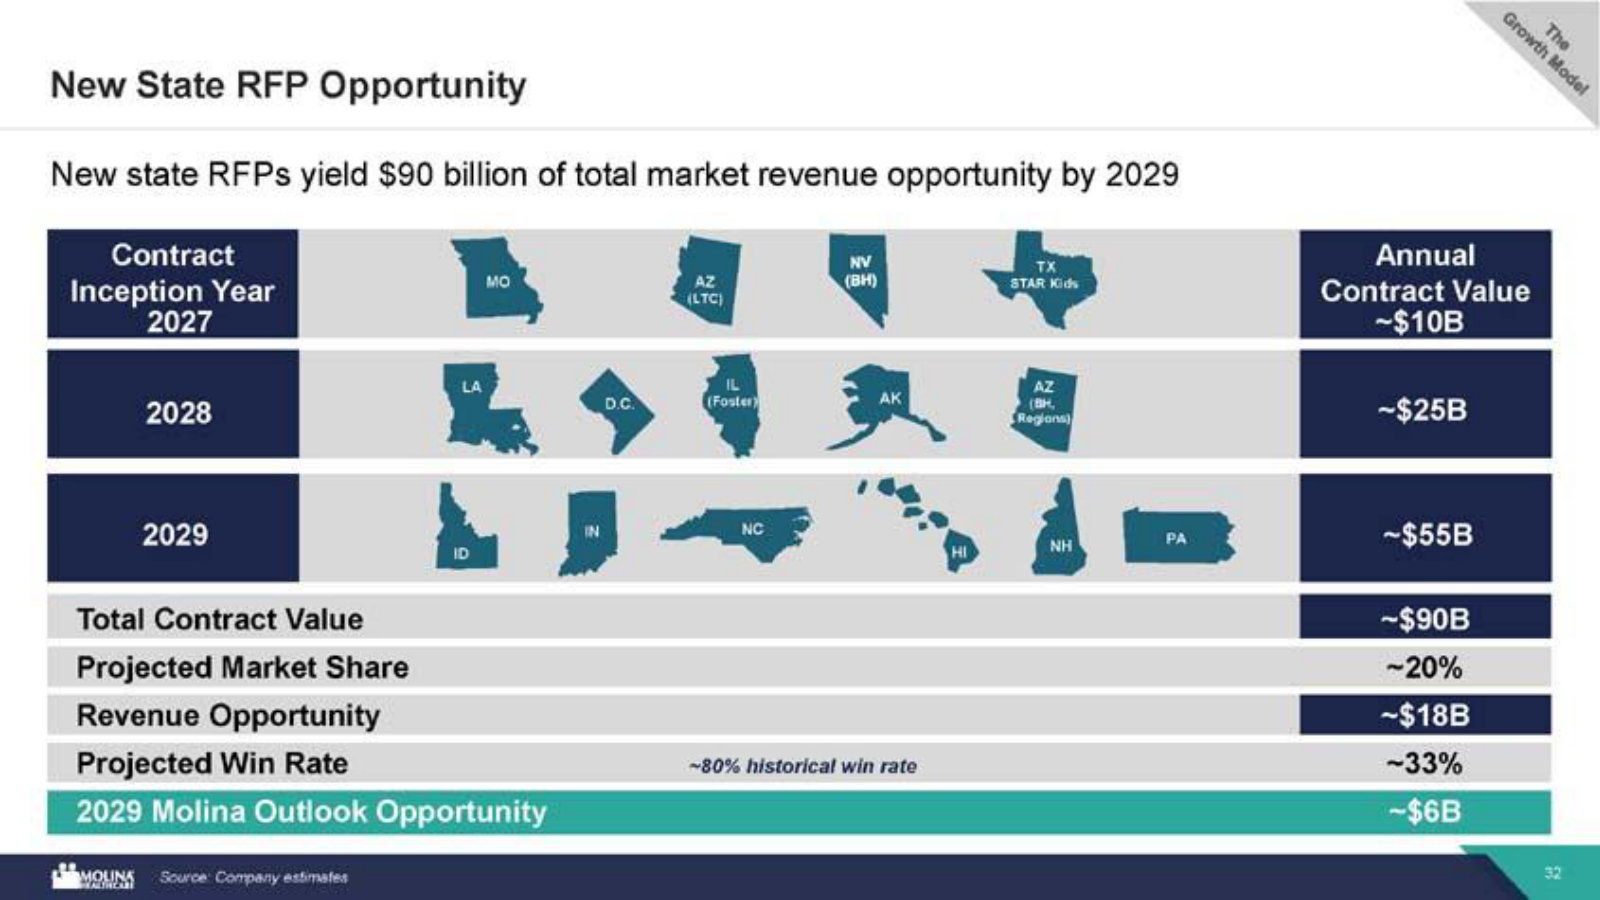
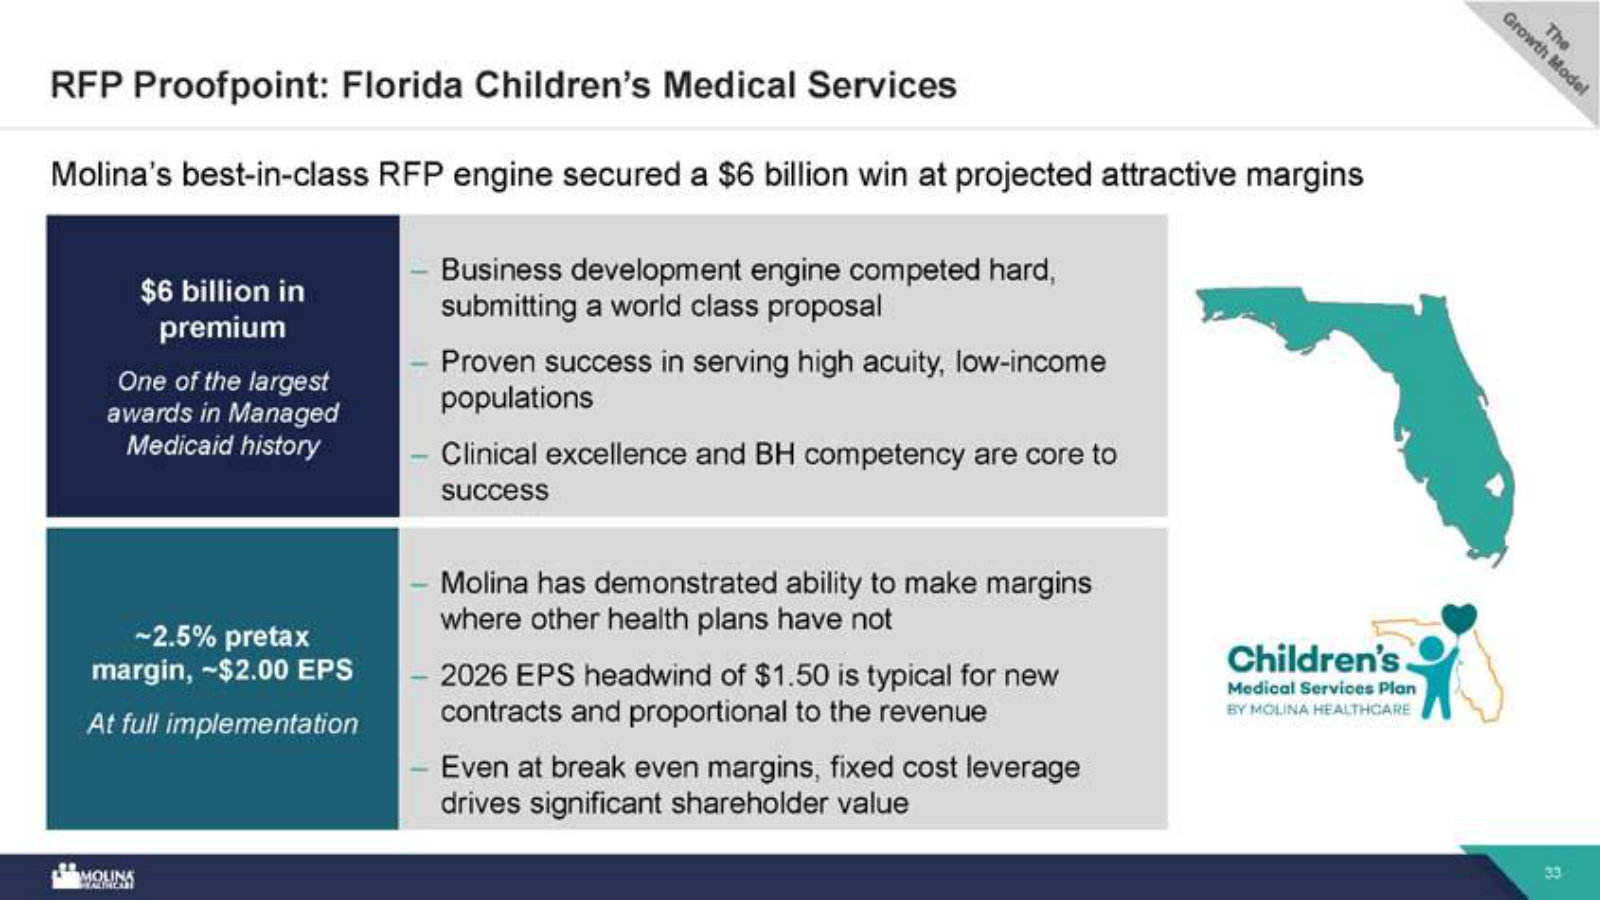
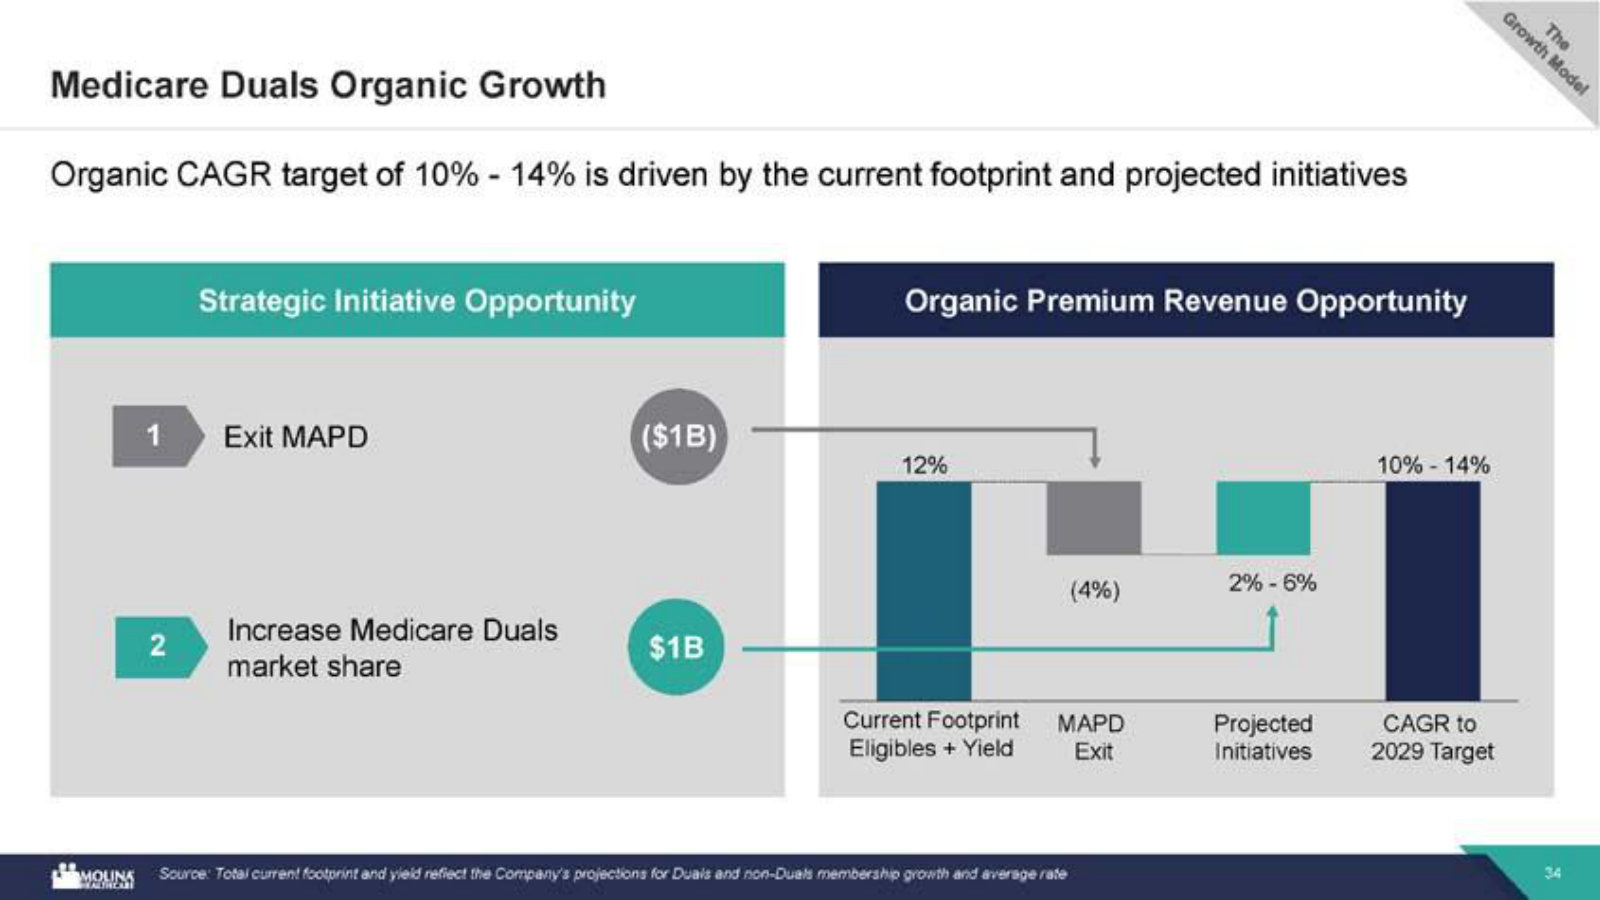
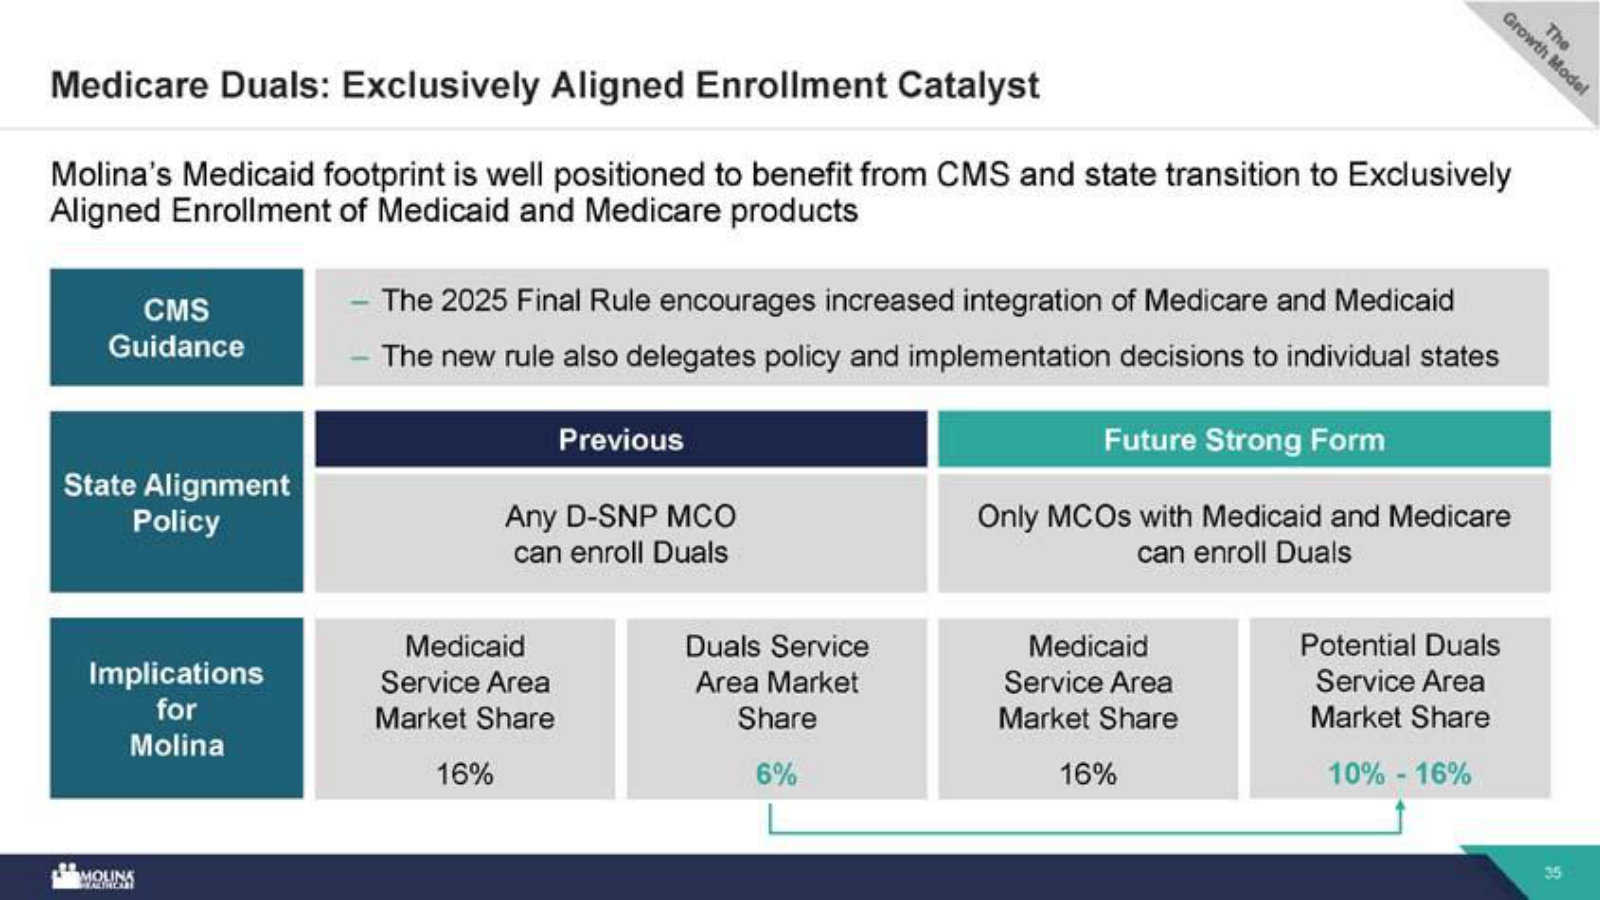
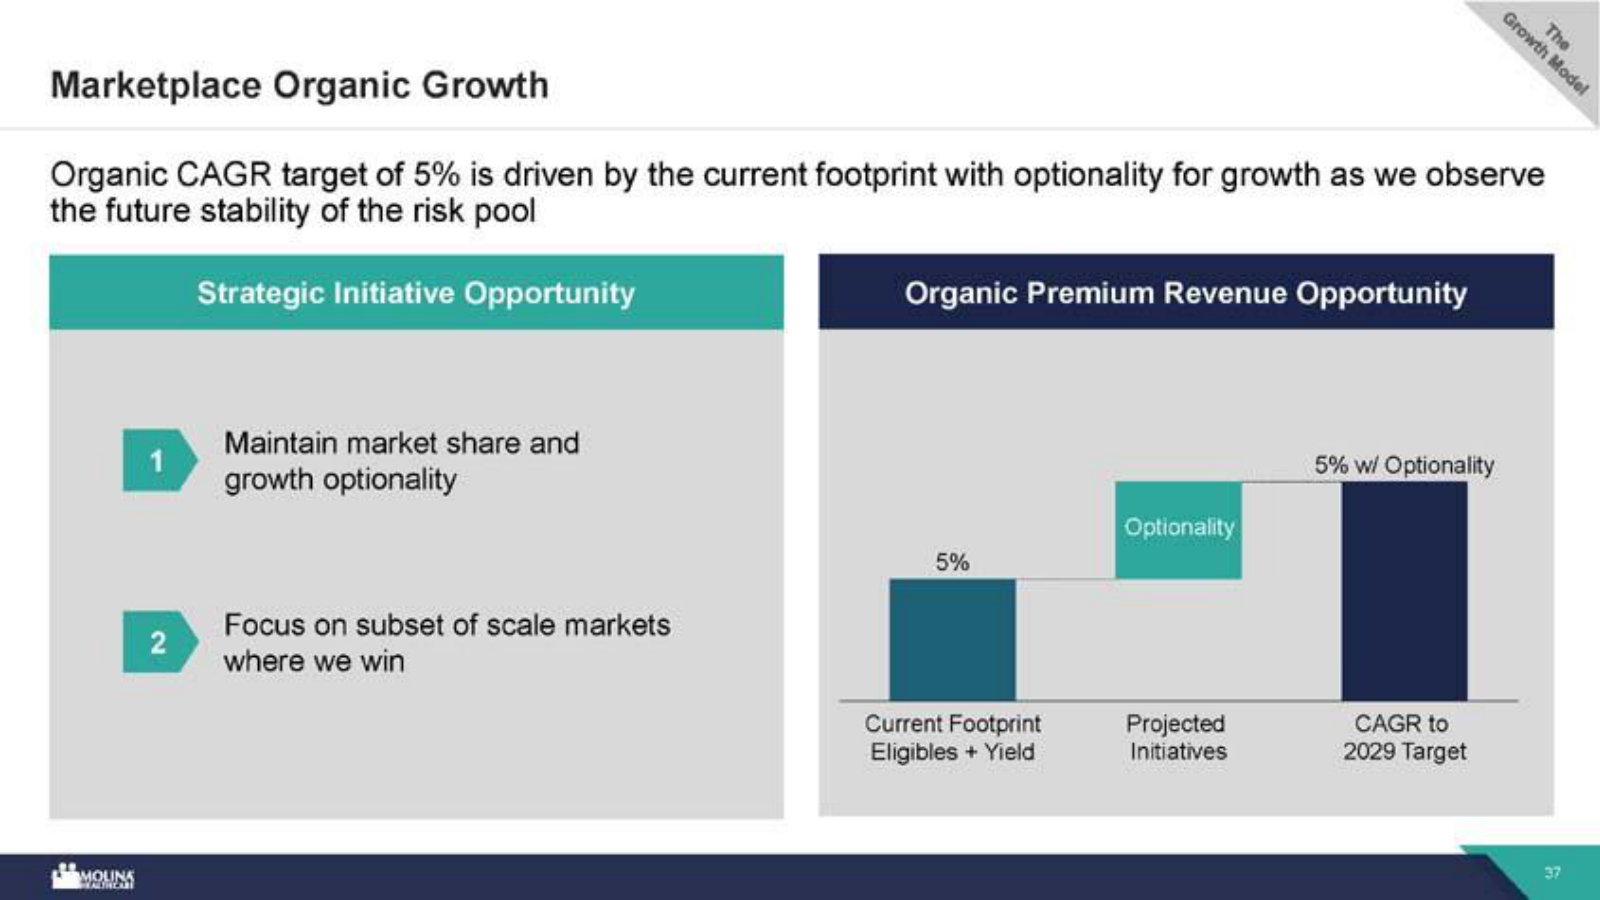
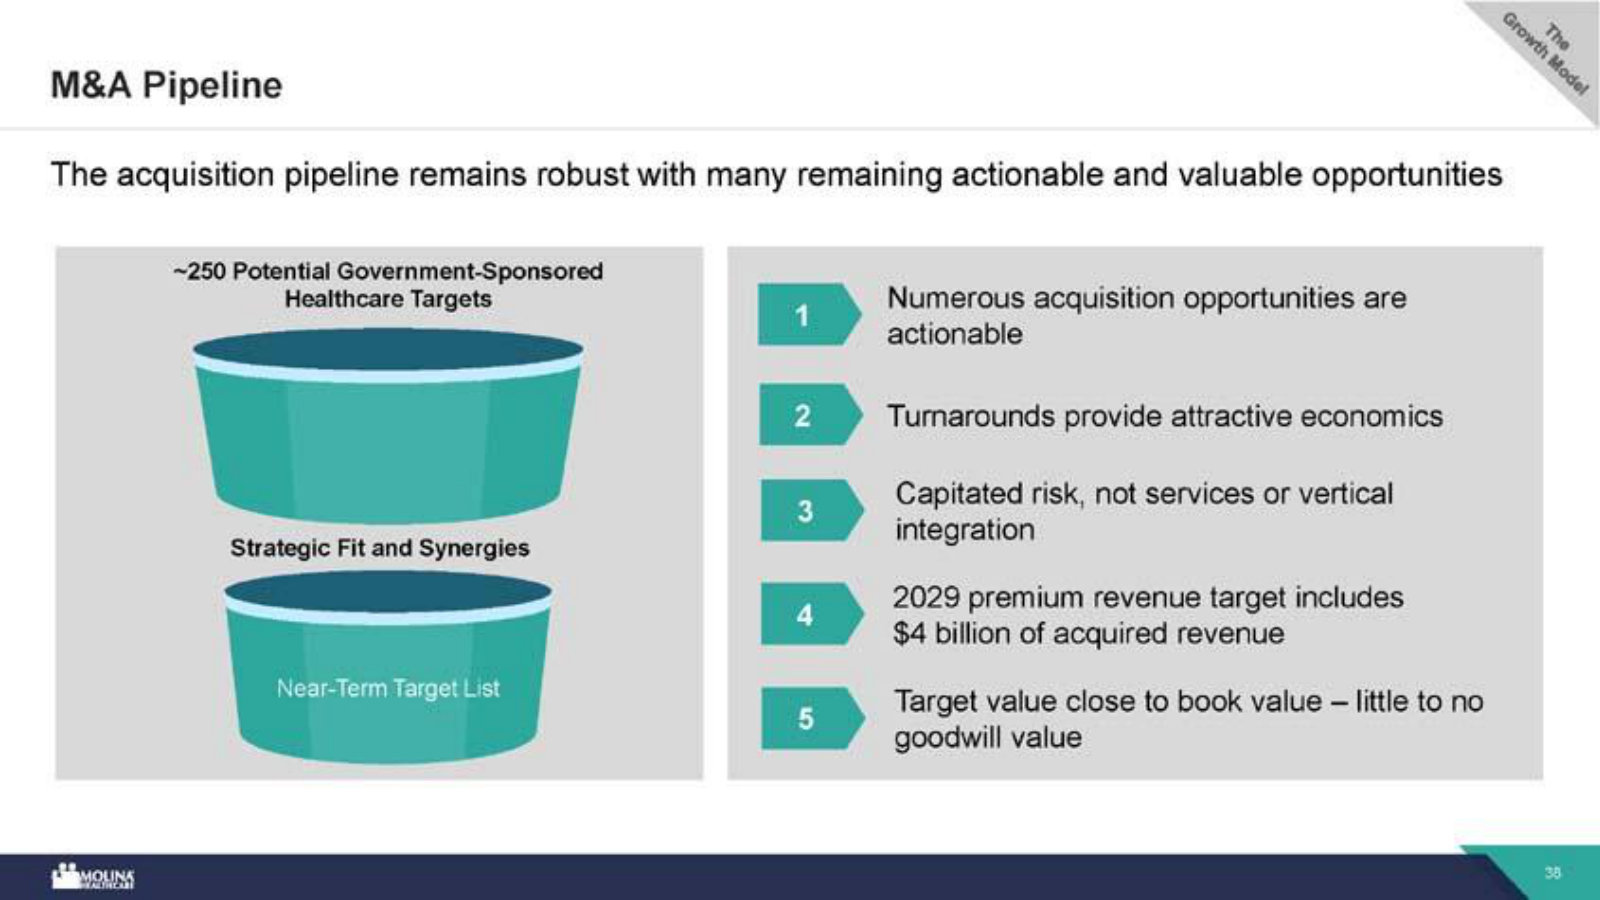
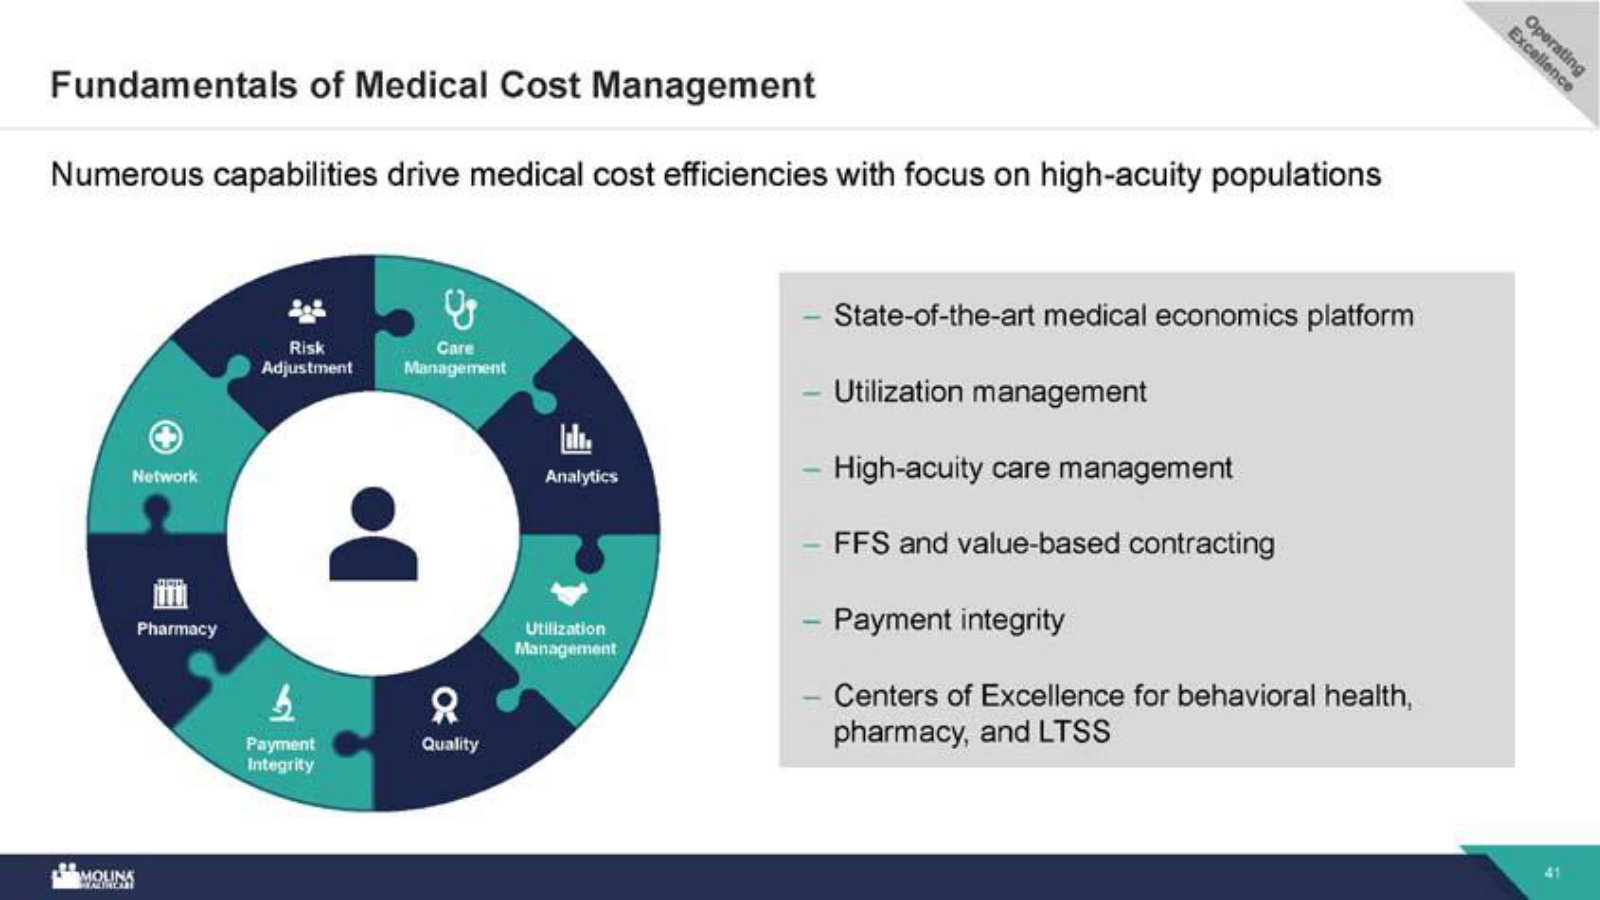
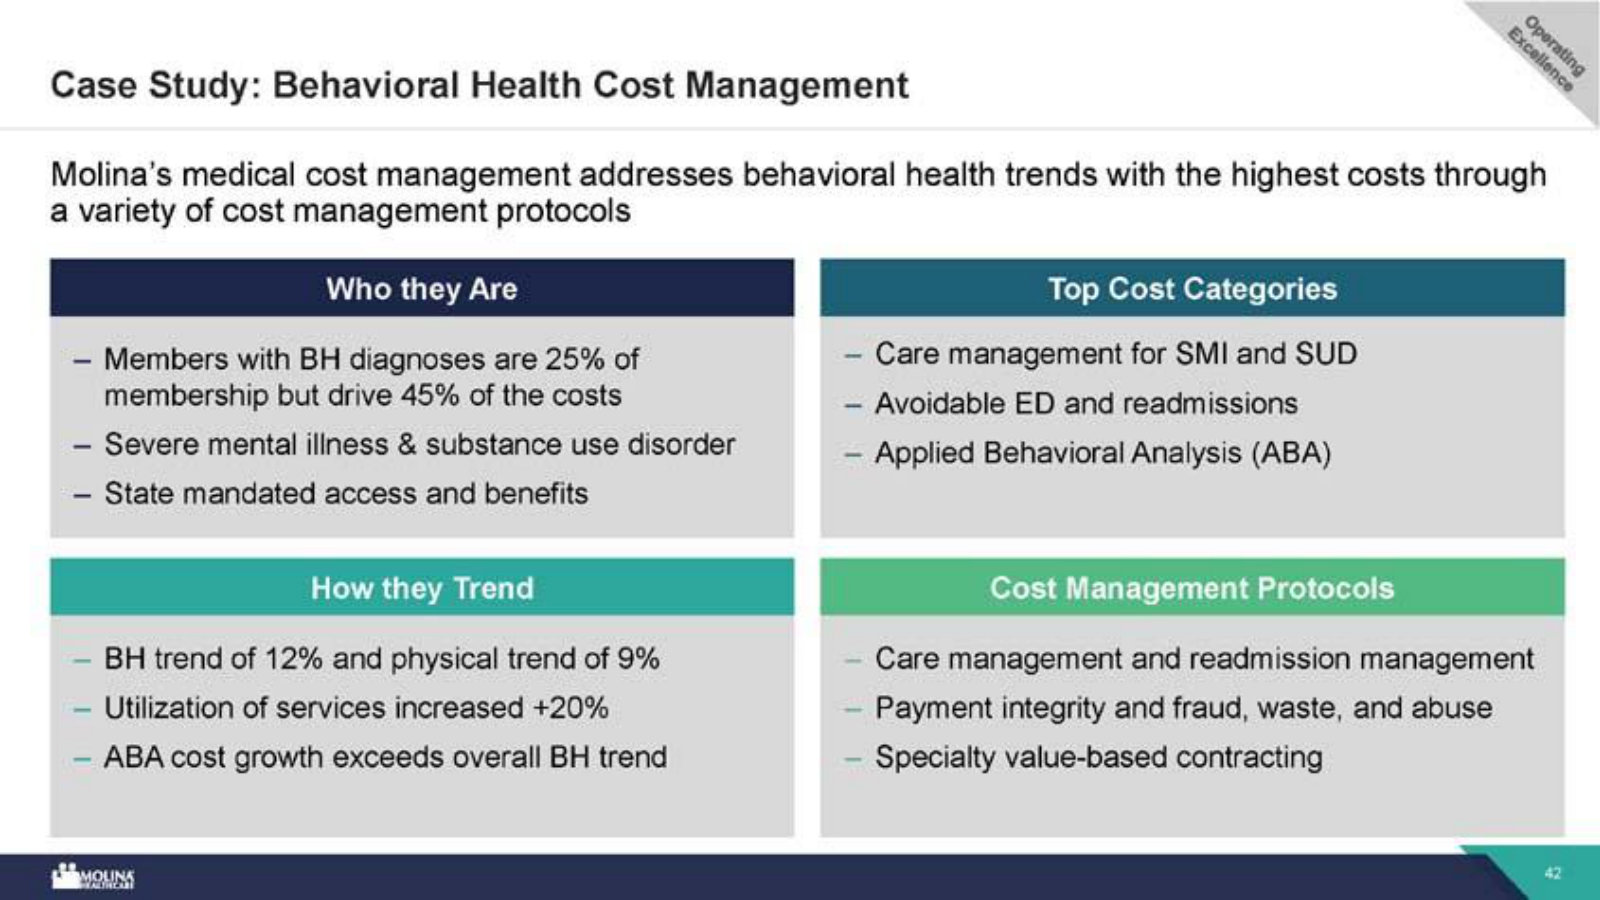
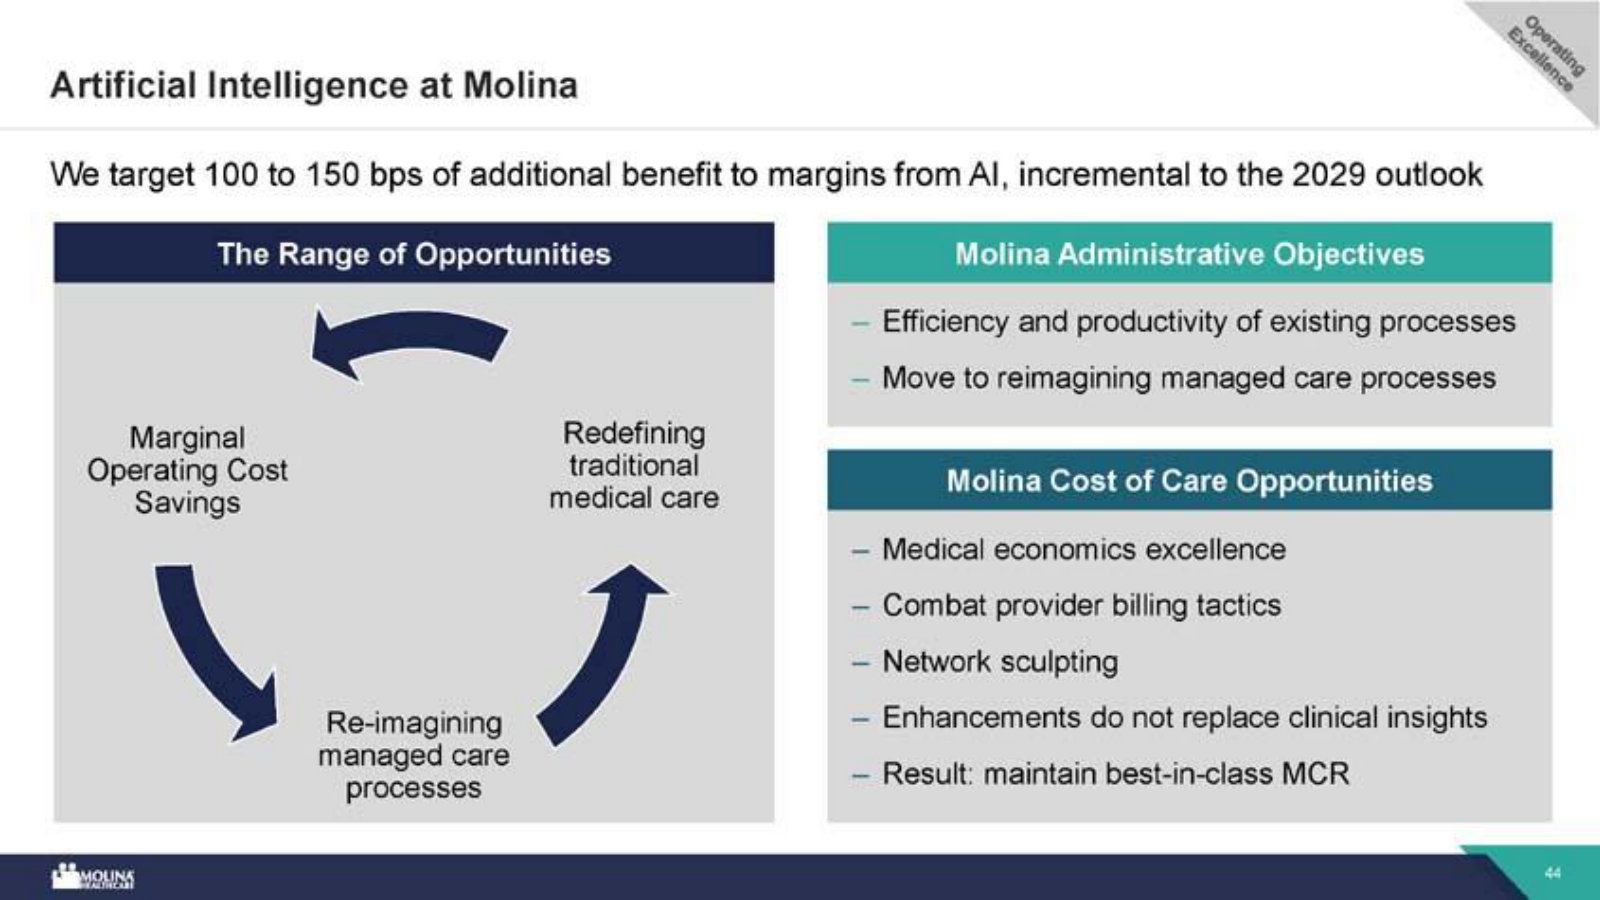
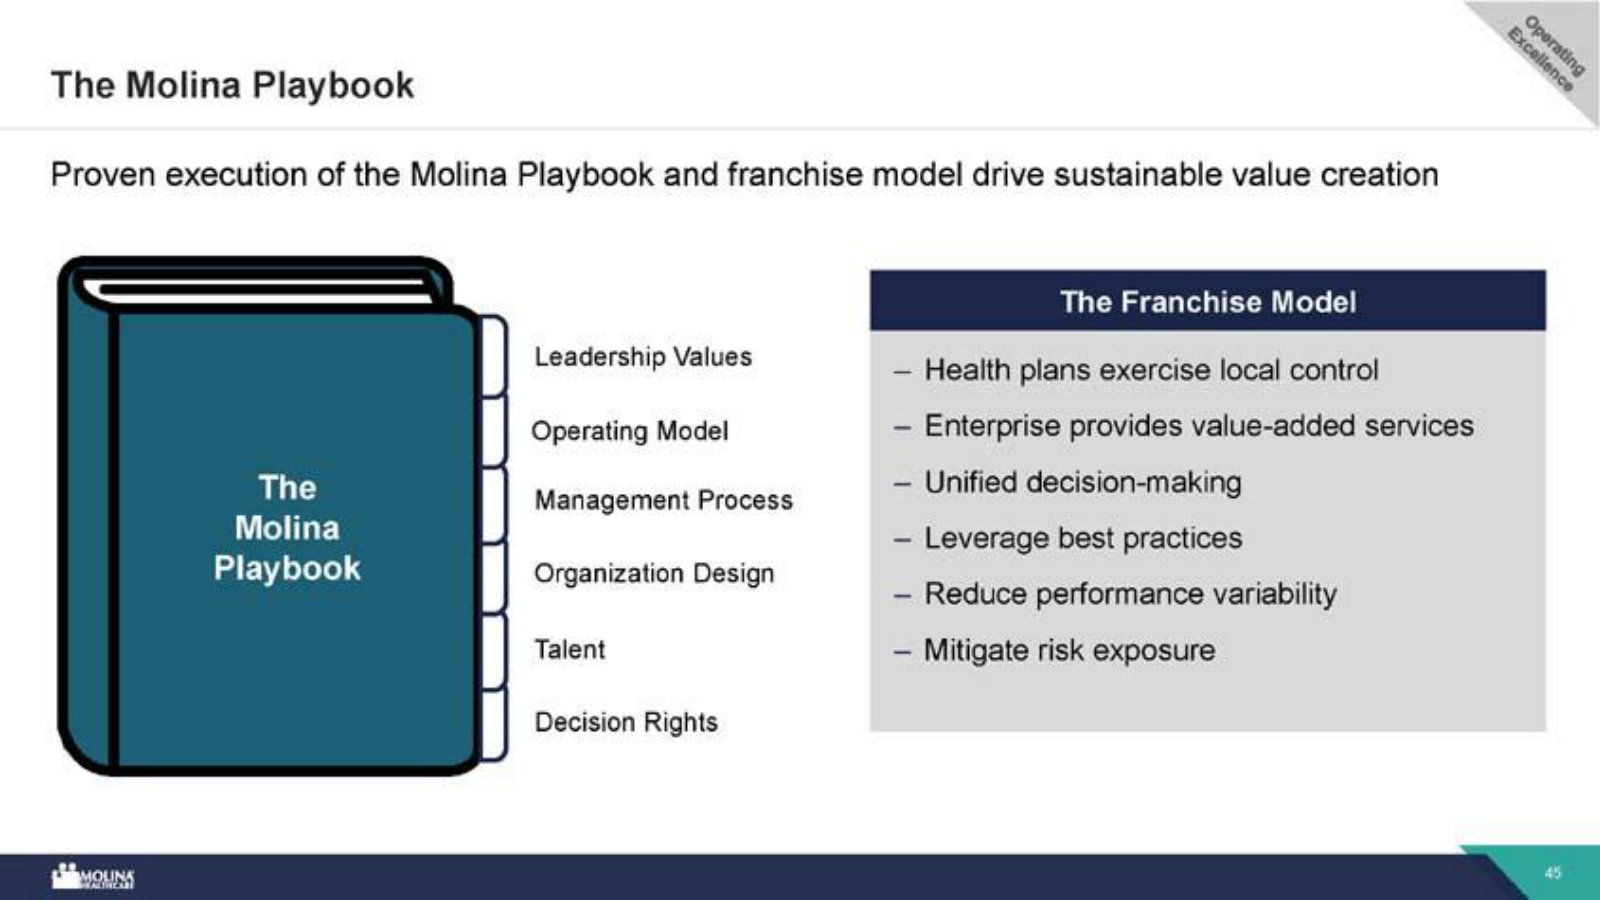
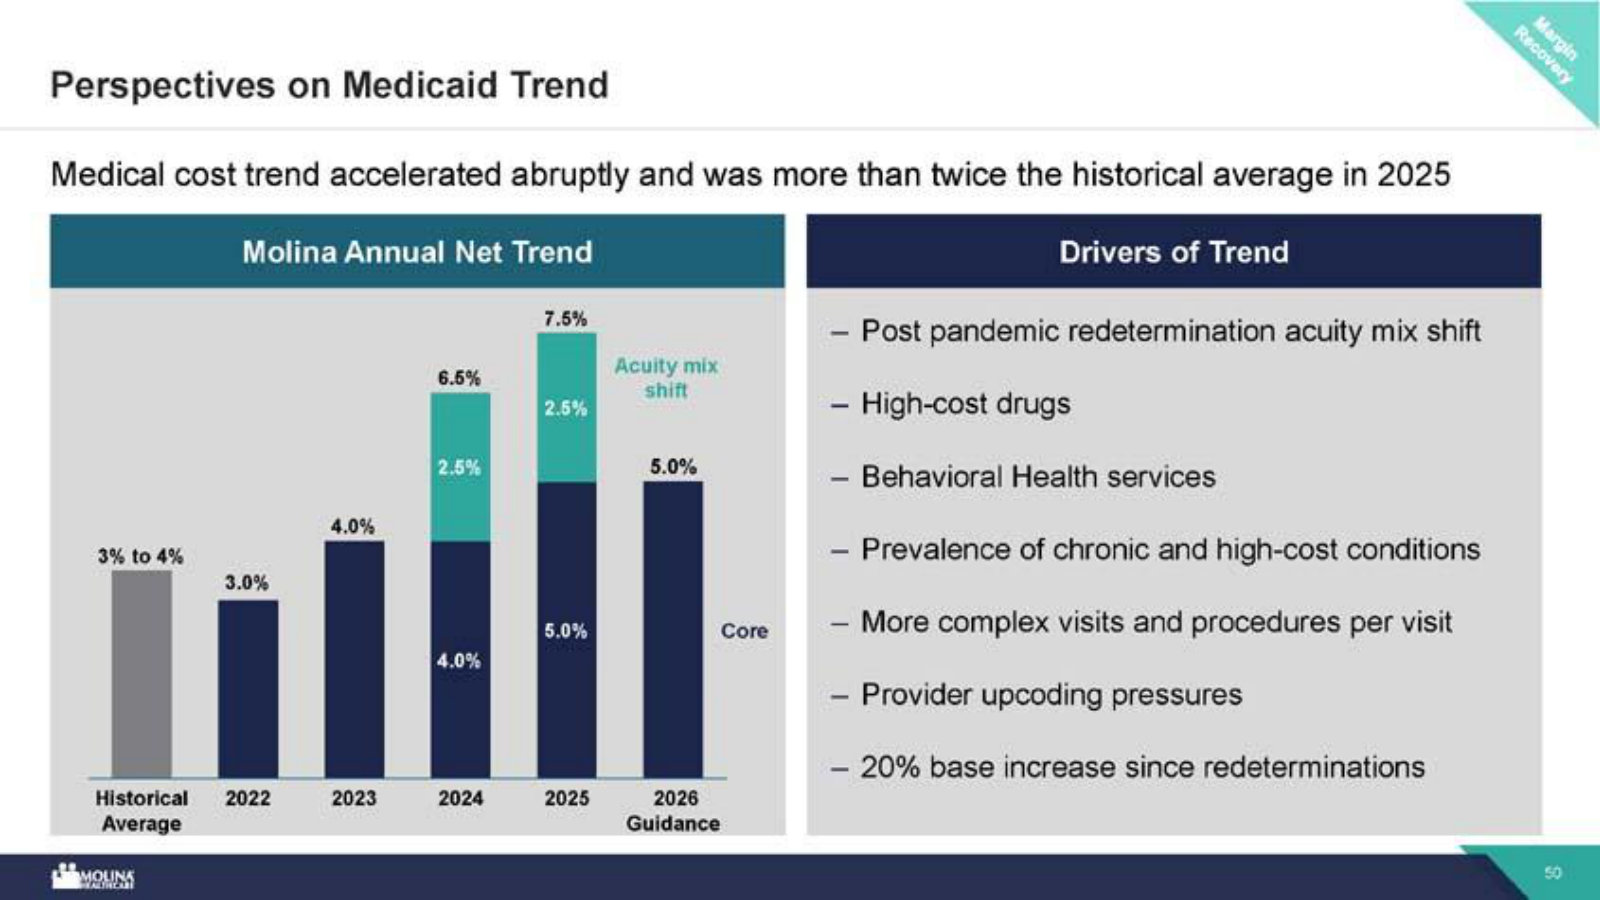
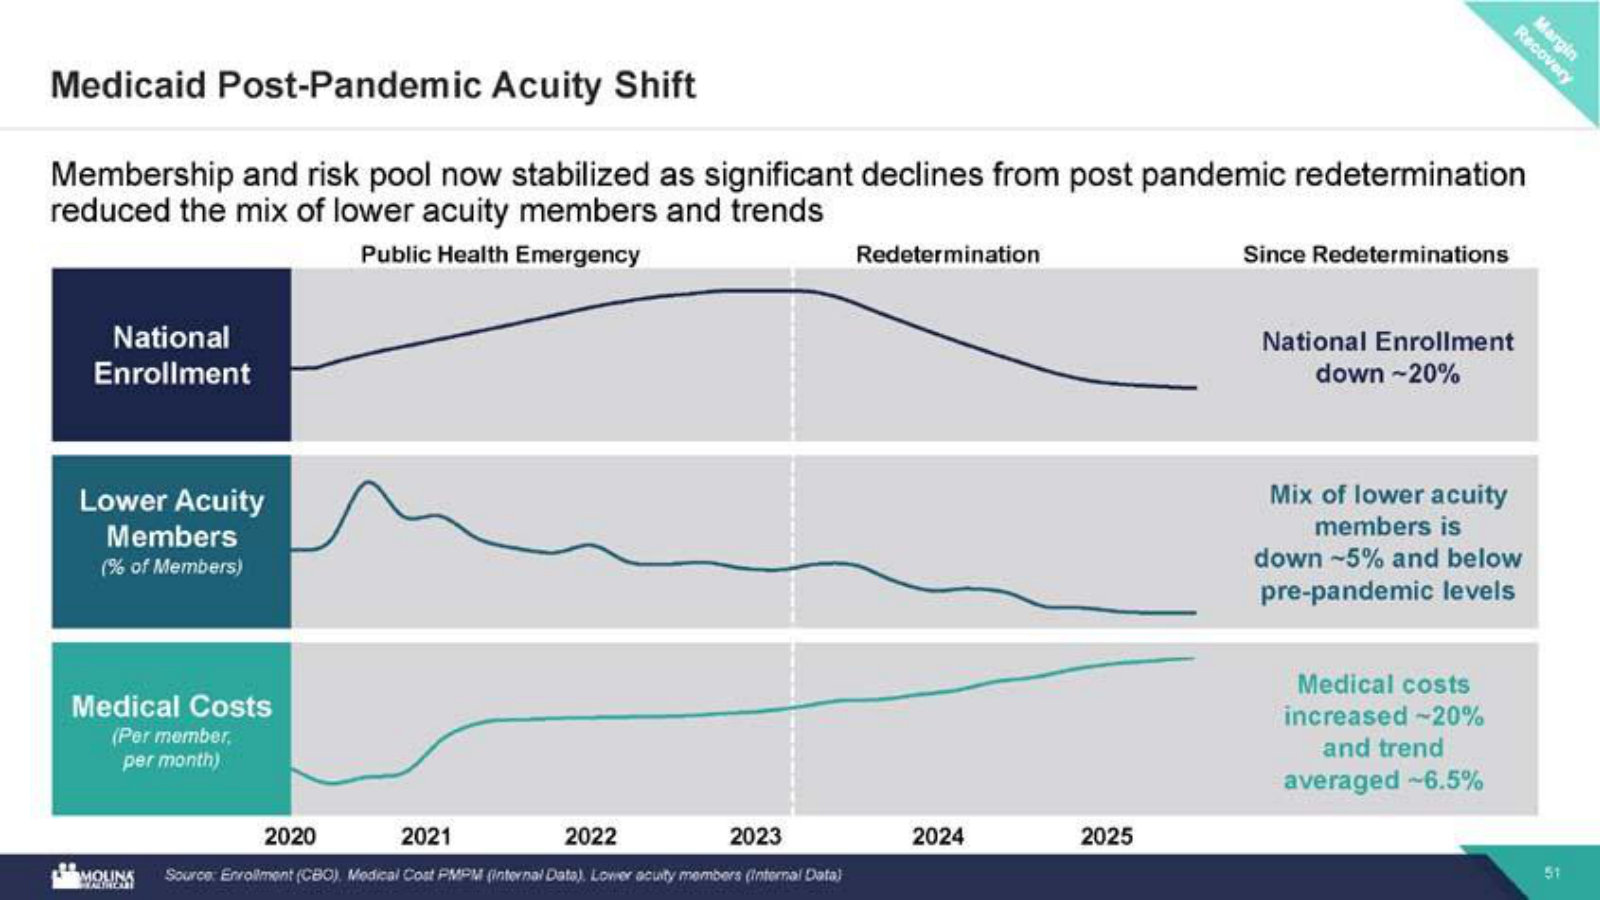
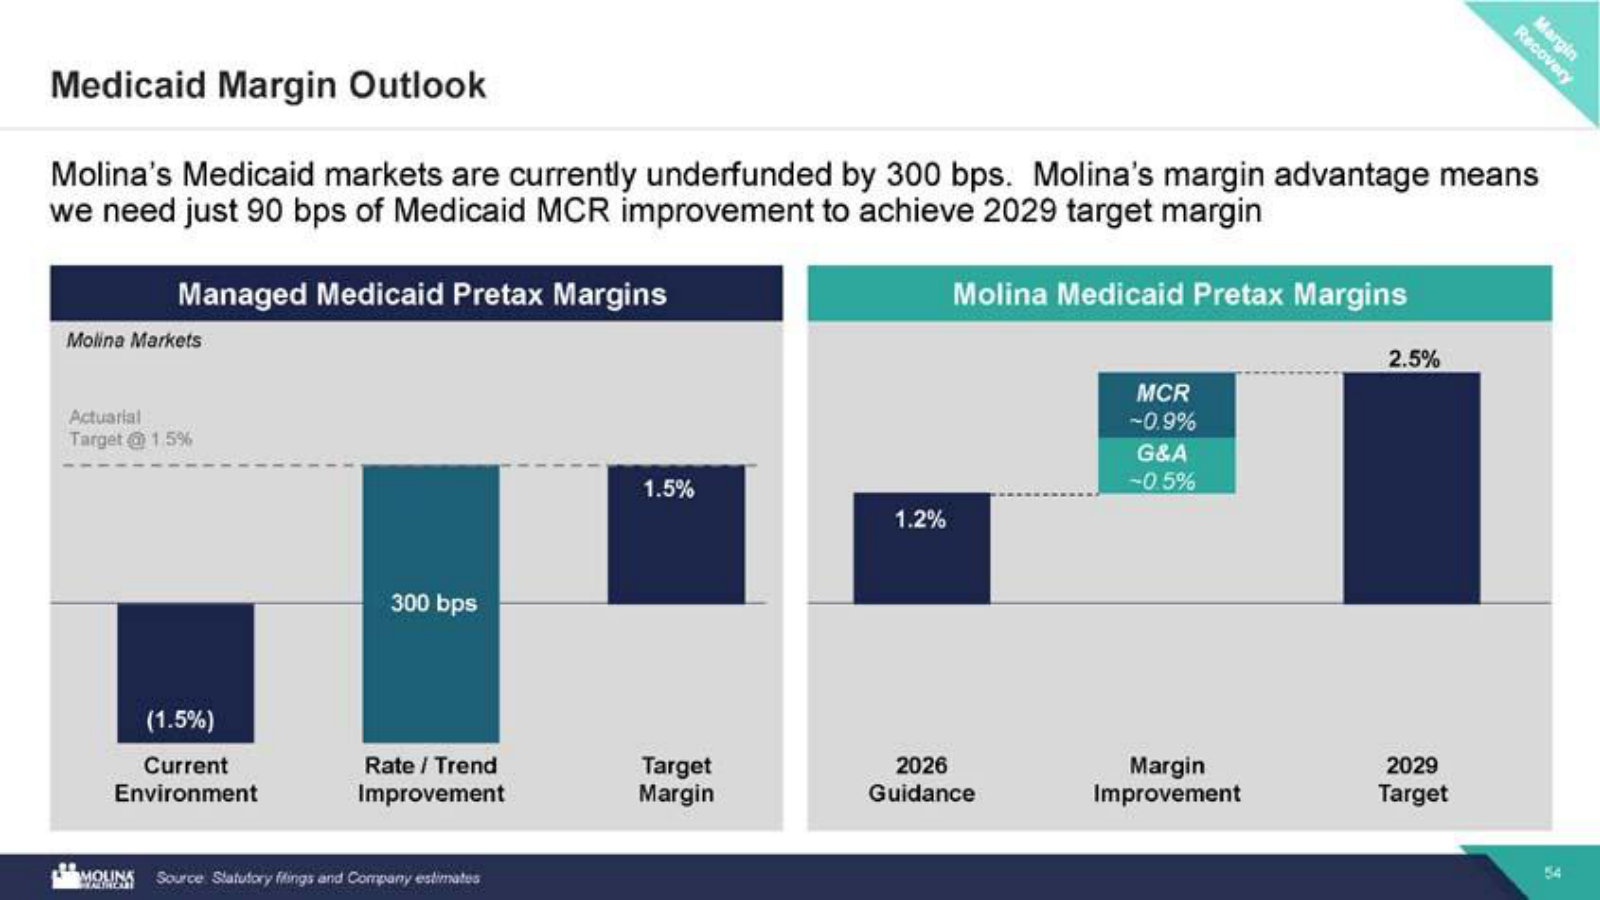
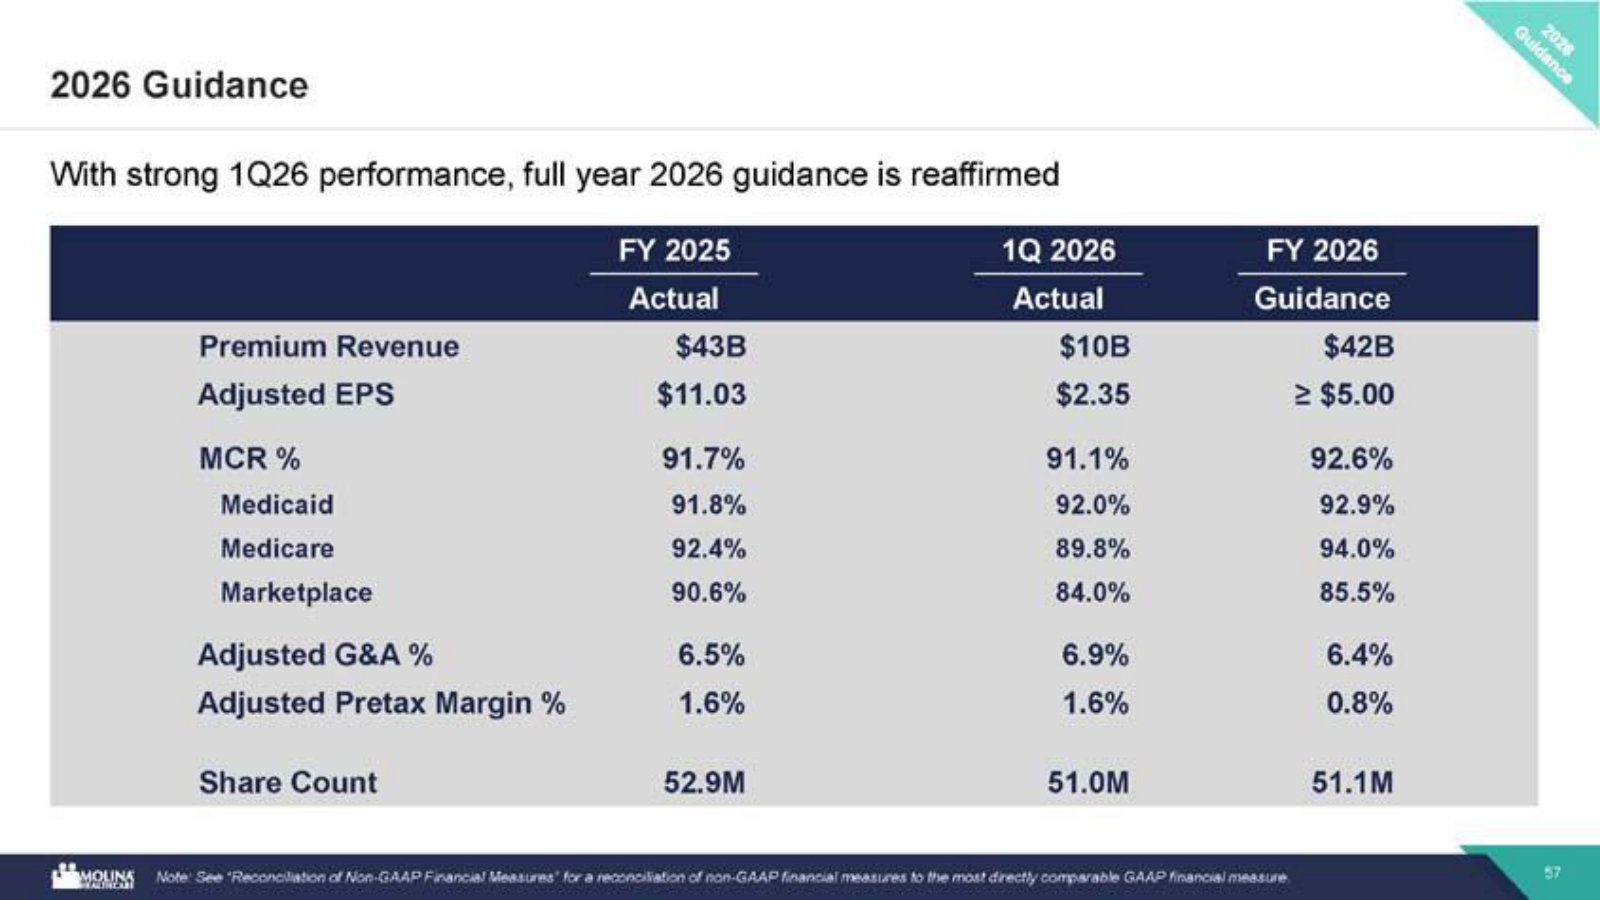
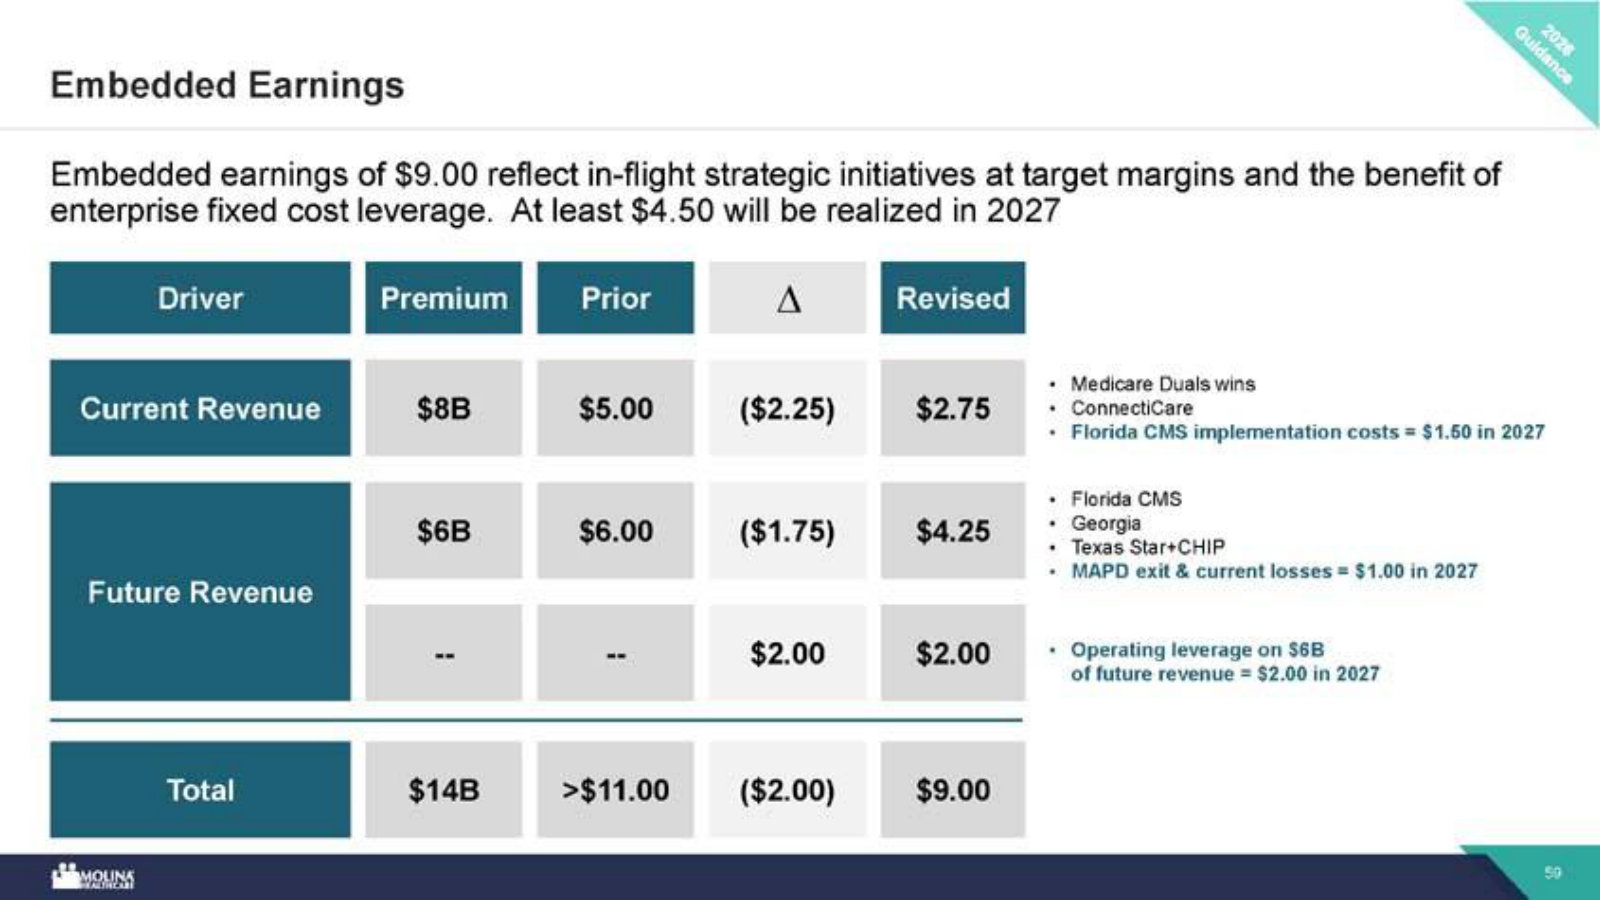
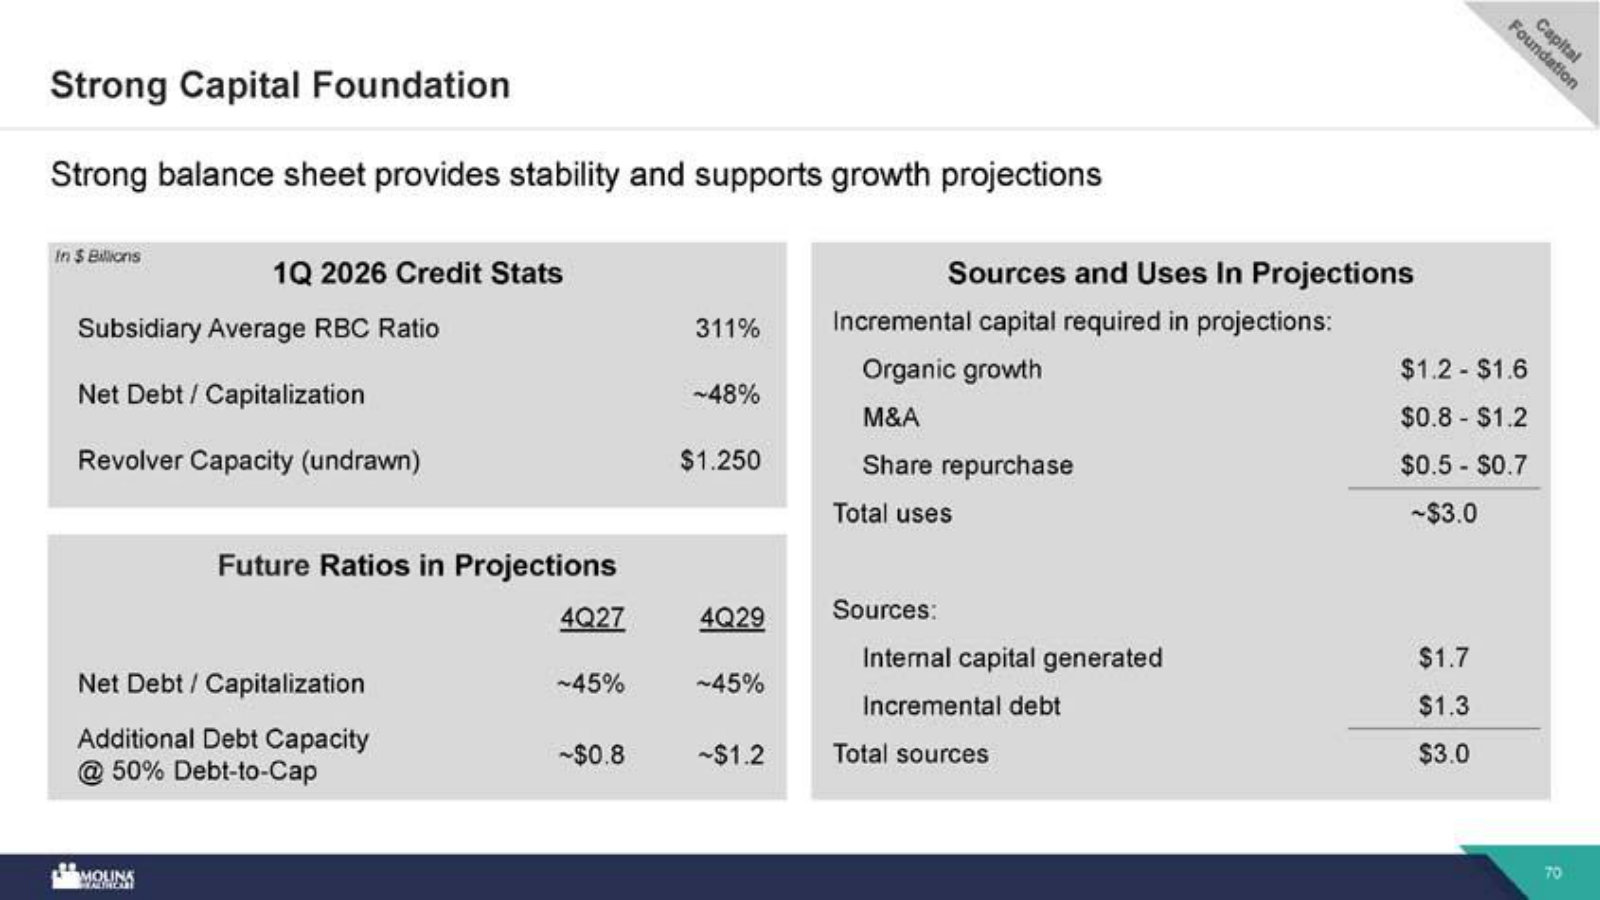
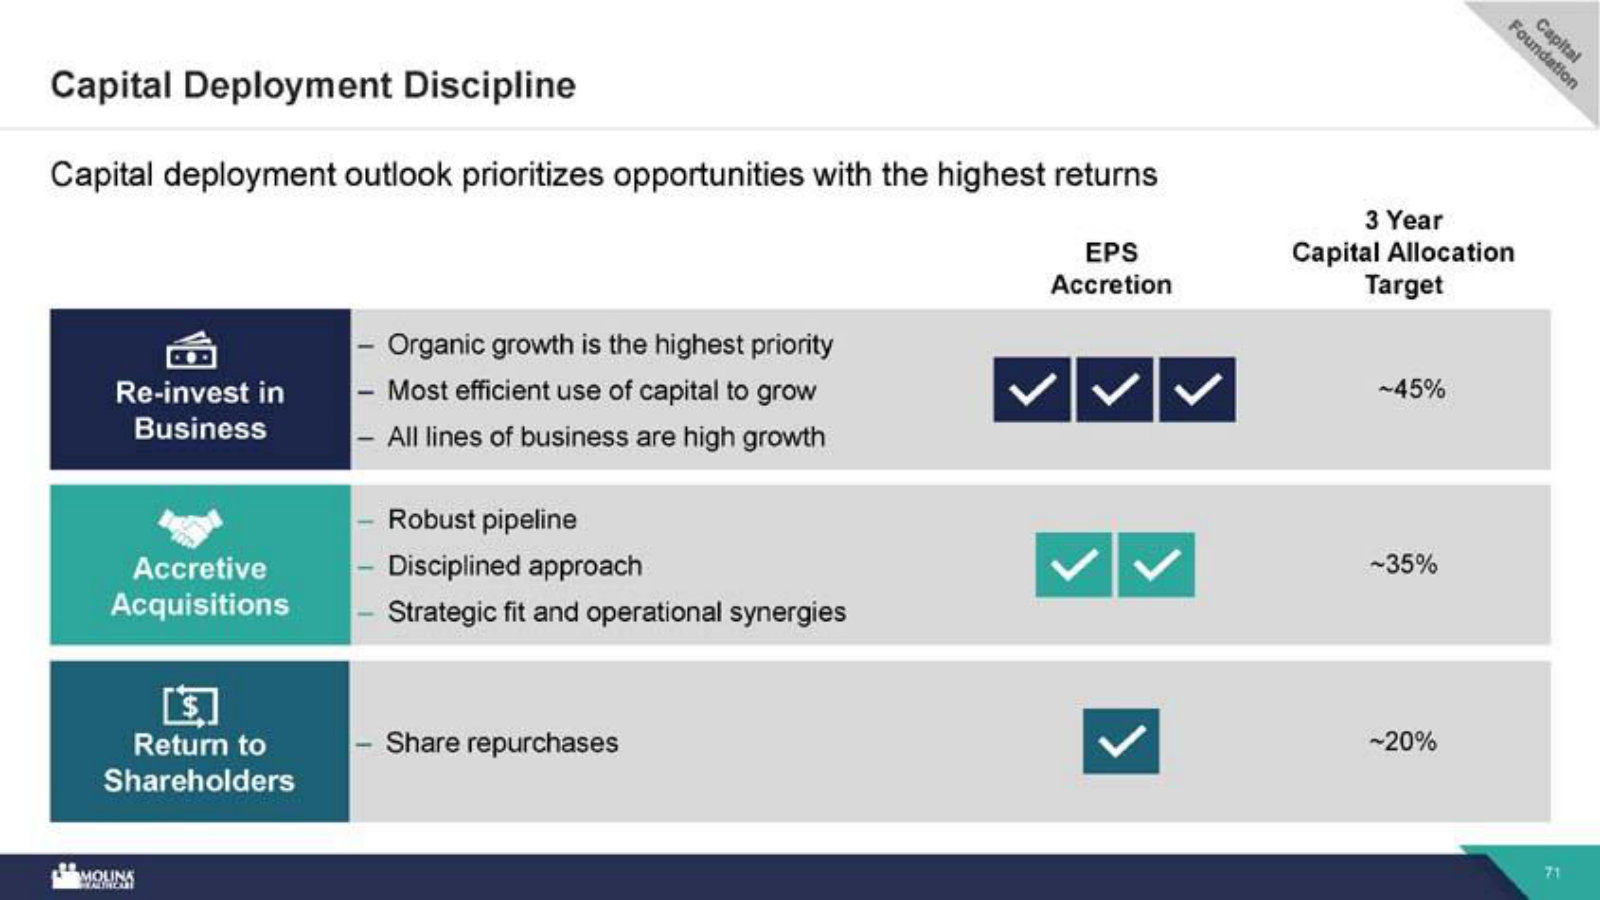
p. 8 — The 2029 destination in one table: $64B premium at 15% CAGR, ~91–92% MCR, and $25 adjusted EPS. · Open the full presentation →p. 9 — Waterfall from ~$42B (2026) to ~$64B premium in 2029 — split into current footprint, embedded revenue, new initiatives and M&A. · Open the full presentation →p. 10 — The $25 EPS bridge: operating discipline, future revenue growth and Medicaid MCR recovery, adding up to a 70% three-year CAGR. · Open the full presentation →p. 12 — Growth and margin targets by segment — Medicaid, Medicare and Marketplace — showing organic CAGR and where each MCR is expected to land. · Open the full presentation →p. 18 — The company at a glance: ~$42B premium, 5.0M members, 21 states, three products — a pure-play government-sponsored insurer. · Open the full presentation →p. 19 — Track record 2018–2024: 14% premium CAGR, ~80% new-RFP win rate, eight acquisitions and ~150% total shareholder return. · Open the full presentation →p. 20 — Where the revenue sits — a 21-state map and the 79% Medicaid / 16% Medicare / 5% Marketplace split of ~$42B premium. · Open the full presentation →p. 22 — The RFP engine: a 90% win rate on reprocurements and 80% on new-state bids, the mechanism behind organic growth. · Open the full presentation →p. 23 — Eight acquisitions from 2019–2025 adding over $10B in premium — the M&A cadence that more than doubled the company. · Open the full presentation →p. 24 — Adjusted EPS and pretax margin by year since 2019, showing the sharp 2025–26 earnings drop as medical cost trend outran rates. · Open the full presentation →p. 26 — Segment pretax margins 2021–2026, quantifying how far Medicaid, Medicare and Marketplace fell below trailing performance. · Open the full presentation →p. 27 — Why Molina still earns where the market loses — managed Medicaid is underfunded ~300 bps, but Molina runs ~400 bps better. · Open the full presentation →p. 28 — The regulatory scorecard — catalysts and challenges across Medicaid, Medicare Duals and Marketplace on one matrix. · Open the full presentation →p. 29 — The membership headwind: how work requirements, reverifications and the One Big Beautiful Bill trim Medicaid enrollment 2–3% a year. · Open the full presentation →p. 31 — How Medicaid reaches 12–14% organic growth — rate expectations, embedded revenue from contracts won, and new RFP wins. · Open the full presentation →p. 32 — The new-state RFP pipeline: ~$90B of contracts up for bid through 2029, mapped by contract inception year. · Open the full presentation →p. 33 — A worked example — the $6B Florida Children's Medical Services win, and the economics of a new contract (~2.5% margin, ~$2 EPS at maturity). · Open the full presentation →p. 34 — The Medicare Duals growth build to 10–14%, including the planned MAPD exit and duals share gains. · Open the full presentation →p. 35 — The duals tailwind: CMS's shift to Exclusively Aligned Enrollment favors insurers, like Molina, that hold both Medicaid and Medicare. · Open the full presentation →p. 37 — Marketplace kept deliberately small — 5% growth with optionality, sized to the stability of the risk pool. · Open the full presentation →p. 38 — The M&A opportunity set: ~250 potential government-sponsored targets, bought near book value with little goodwill. · Open the full presentation →p. 41 — The medical-cost-management toolkit — risk adjustment, utilization, pharmacy, payment integrity — the capabilities behind the MCR advantage. · Open the full presentation →p. 42 — Behavioral health as a cost lever: 25% of members drive 45% of cost; how Molina manages its highest-trend category. · Open the full presentation →p. 44 — Where AI fits — management targets 100–150 bps of incremental margin from administrative and cost-of-care applications. · Open the full presentation →p. 45 — The operating model: local health-plan control plus a central enterprise playbook, meant to reduce performance variability. · Open the full presentation →p. 50 — What broke the margin — Medicaid medical-cost trend hit 7.5% in 2025, more than double the historical average, and its drivers. · Open the full presentation →p. 51 — The post-pandemic dislocation in one chart: enrollment down ~20% after redeterminations left a higher-acuity, costlier risk pool. · Open the full presentation →p. 54 — The path back: Molina needs only ~90 bps of Medicaid MCR improvement to reach its 2029 target margin. · Open the full presentation →p. 57 — The current financials — FY2025 actuals, 1Q26 and FY2026 guidance across premium, EPS, MCR and margin. · Open the full presentation →p. 59 — Embedded earnings explained — $9.00 of not-yet-realized EPS from contracts already won and operating leverage still to come. · Open the full presentation →p. 70 — The balance sheet behind the plan — RBC ratio, leverage, and the sources and uses of capital funding growth. · Open the full presentation →p. 71 — How capital is allocated — roughly 45% reinvested, 35% to acquisitions, 20% to buybacks, ranked by return. · Open the full presentation →
The prior investor day — best for market size, competitive position and the unit-economics of the MCR advantage that the 2026 deck assumes. · Open the full document →
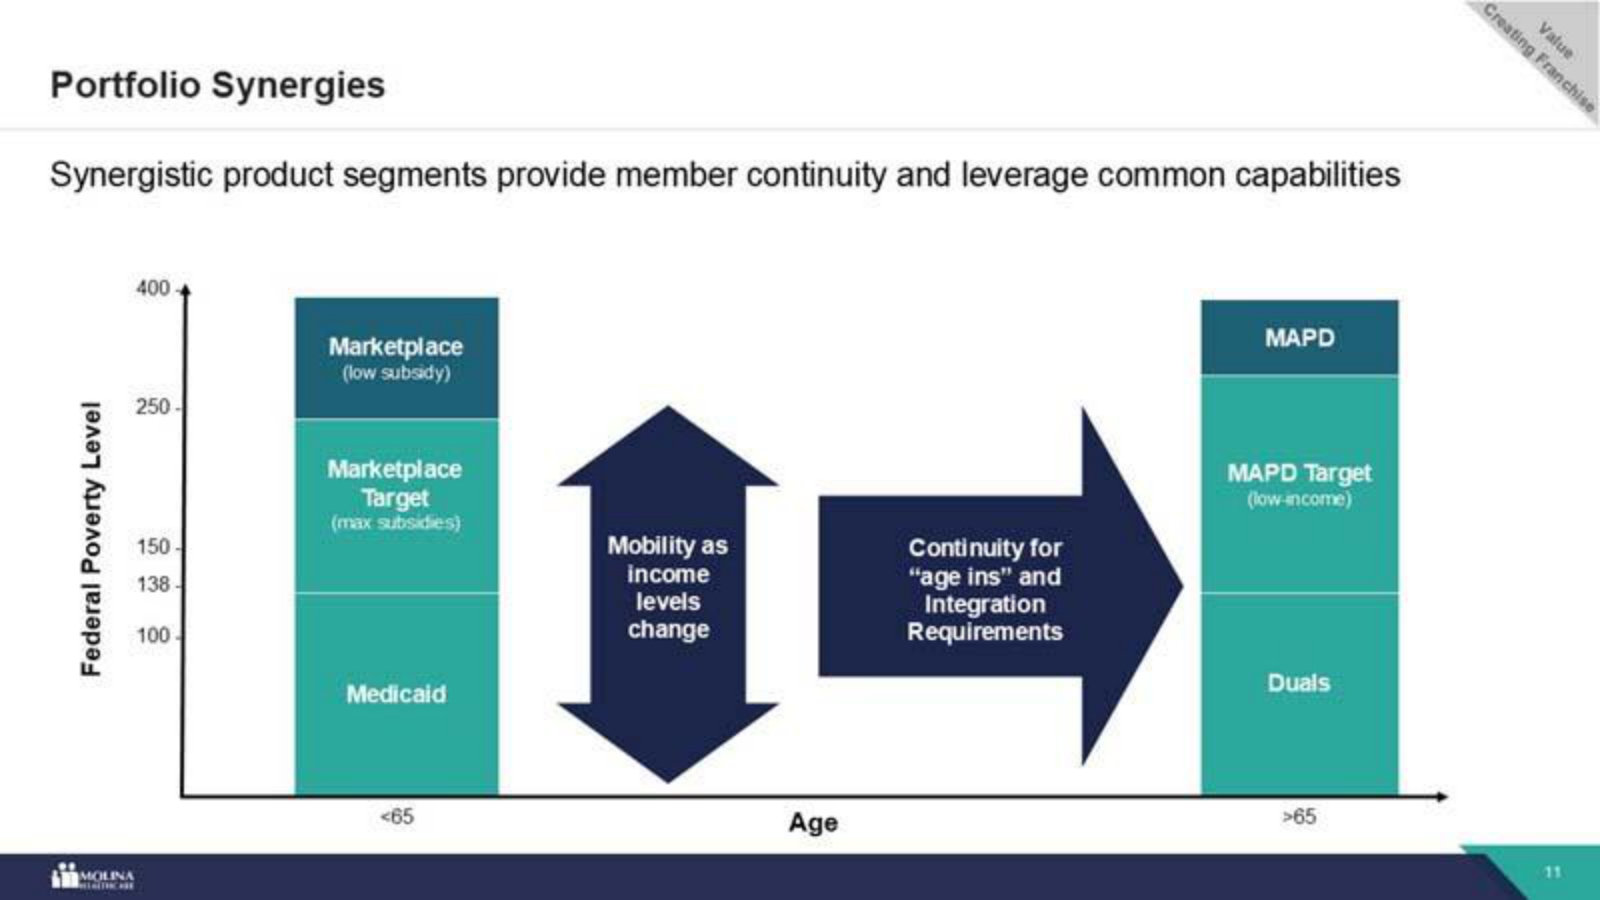
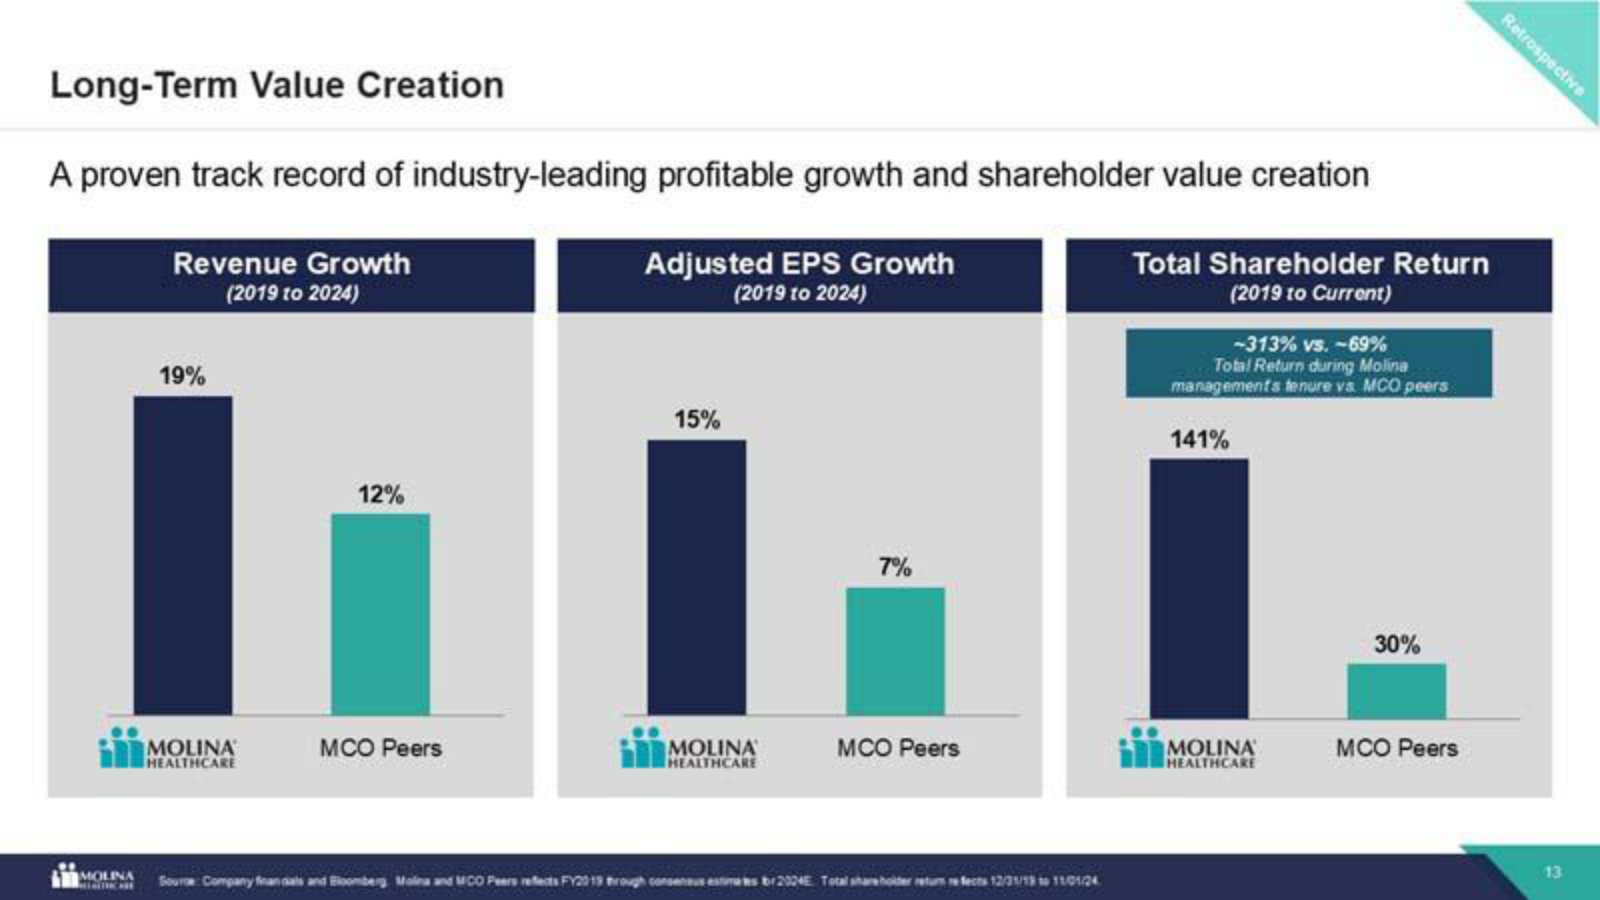
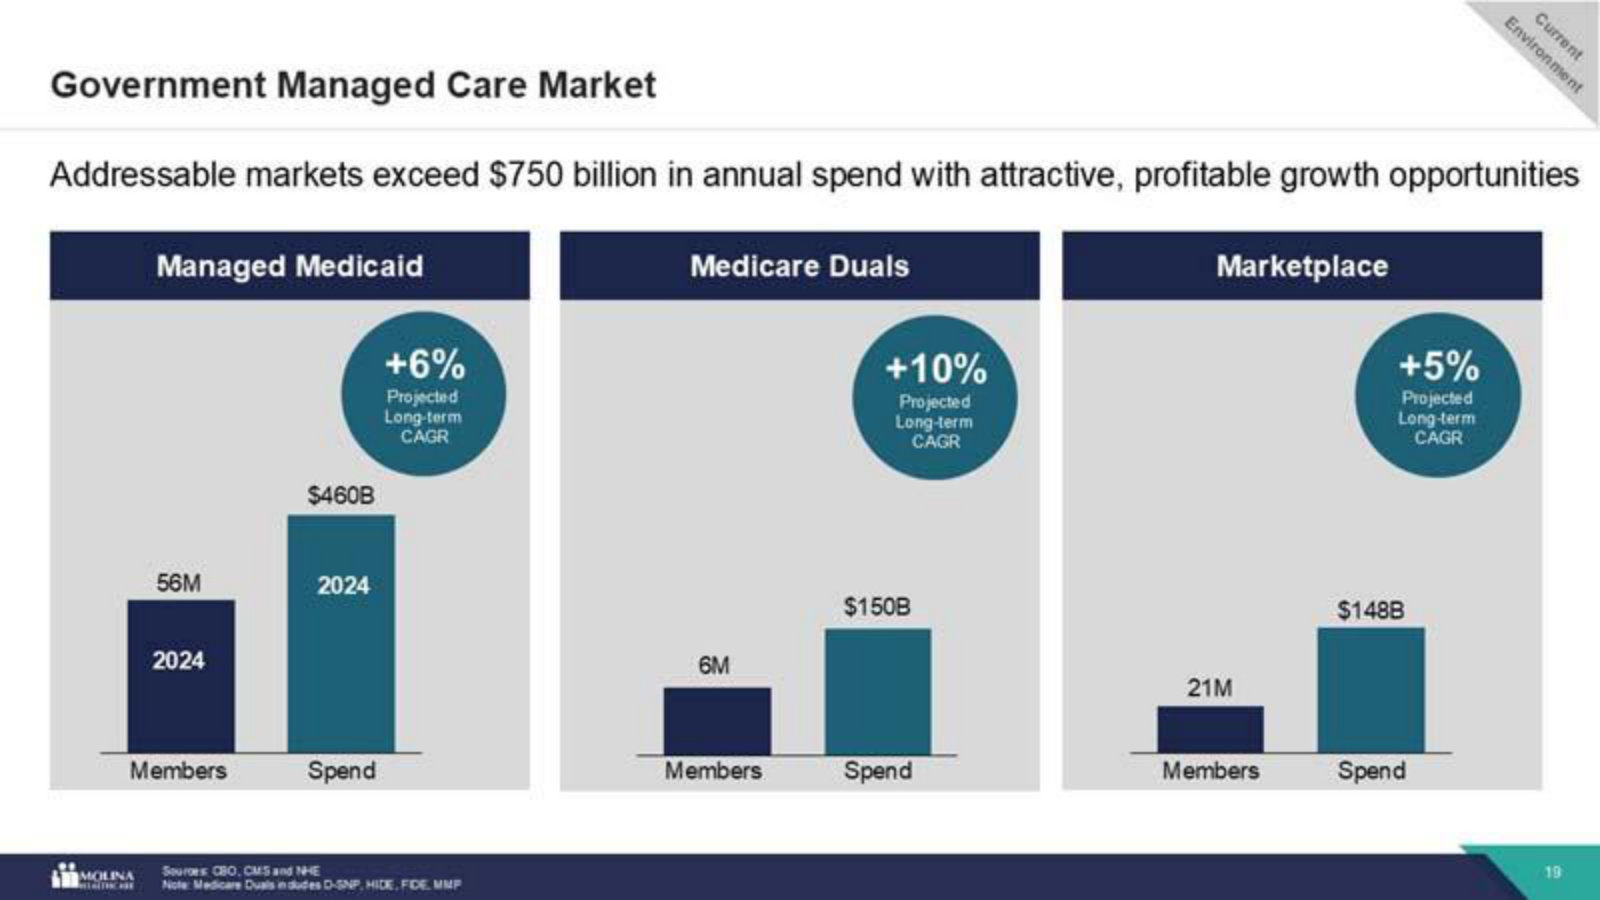
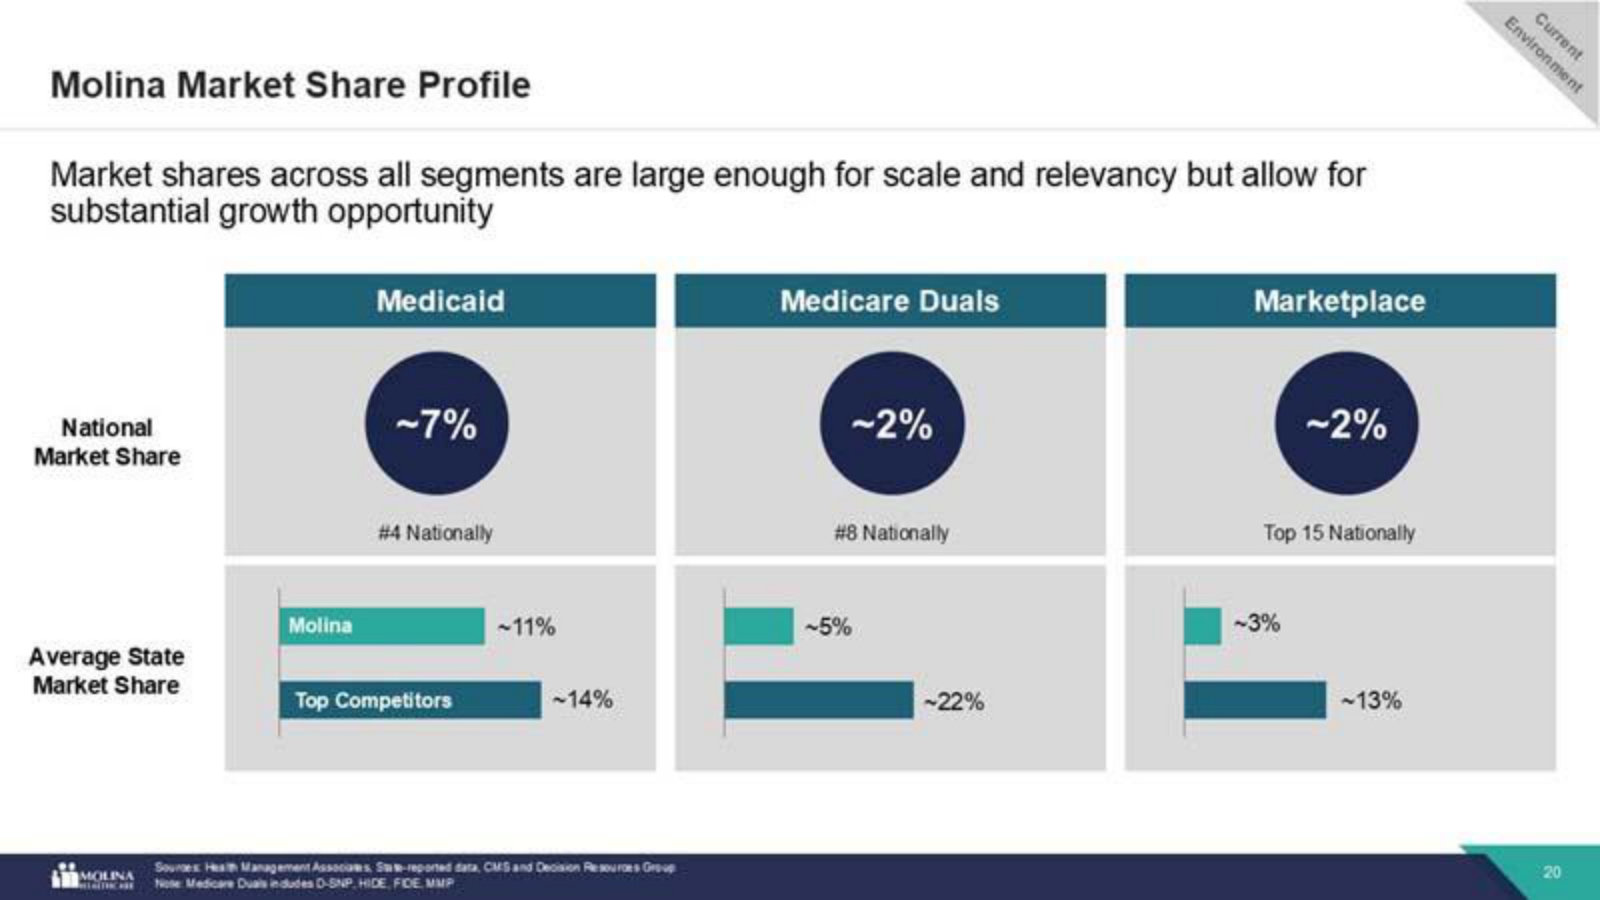
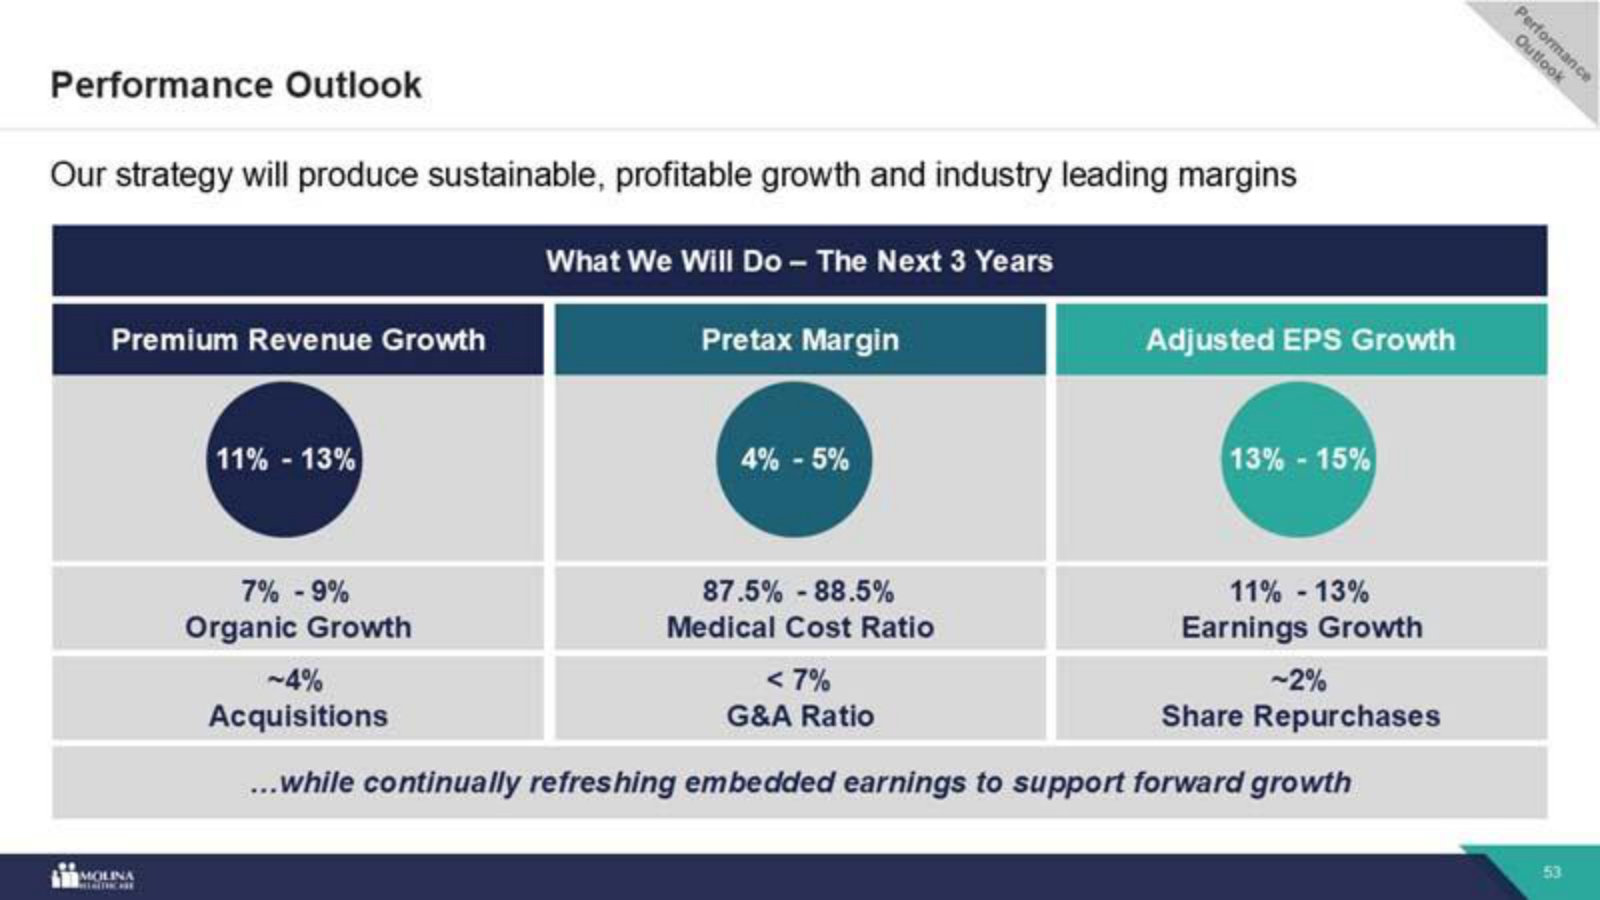
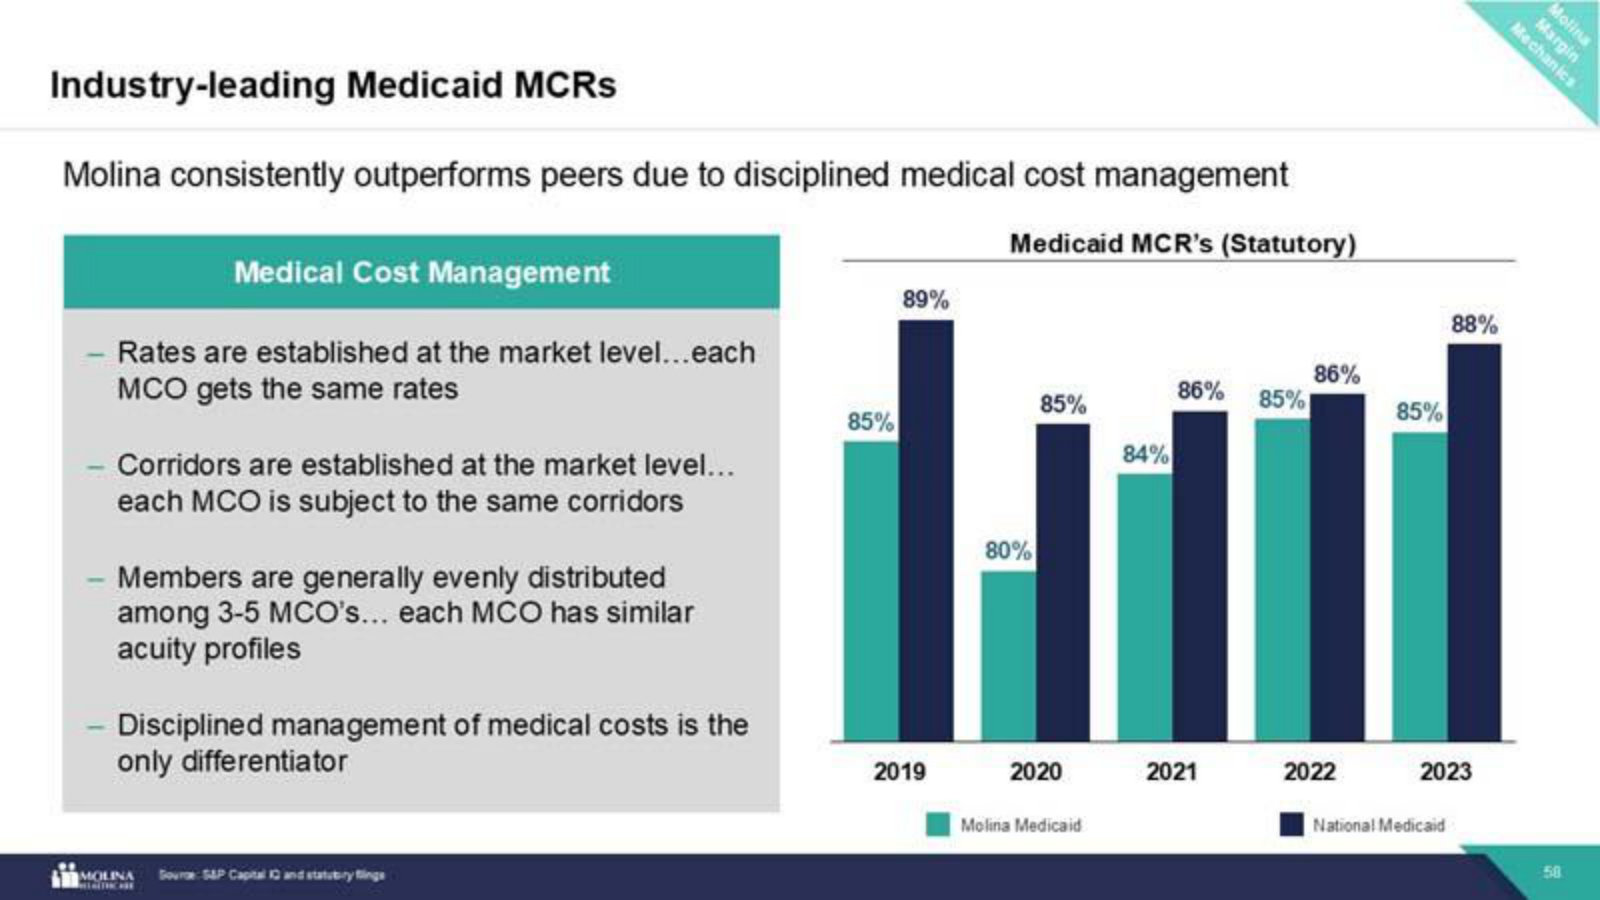
p. 11 — How the three segments connect — coverage moves across Medicaid, Marketplace and Medicare with a member's income and age. · Open the full presentation →p. 13 — Molina versus managed-care peers, 2019–2024 — faster revenue and EPS growth and far higher total shareholder return. · Open the full presentation →p. 19 — The addressable market — managed Medicaid, Medicare Duals and Marketplace together exceed $750B in annual spend. · Open the full presentation →p. 20 — Where Molina ranks — #4 in Medicaid, #8 in Duals — sizable but with room to grow against larger state-level competitors. · Open the full presentation →p. 53 — The prior-cycle framework: how management builds revenue (organic + M&A), margin and EPS (growth + buybacks) into three-year targets. · Open the full presentation →p. 58 — The moat in one chart — every MCO in a market gets the same rates and risk pool, so Molina's lower MCR comes purely from cost discipline. · Open the full presentation →
Investor Day 2023 — 2023 · 79 pages · The earlier edition of this narrative, and where management first set the 2026 premium and EPS targets it is now measured against. · Open →